

On September 19th, the professional database performance testing platform, benchANT, released its latest time-series database ranking. Apache IoTDB emerged as the leader in various performance metrics [1].
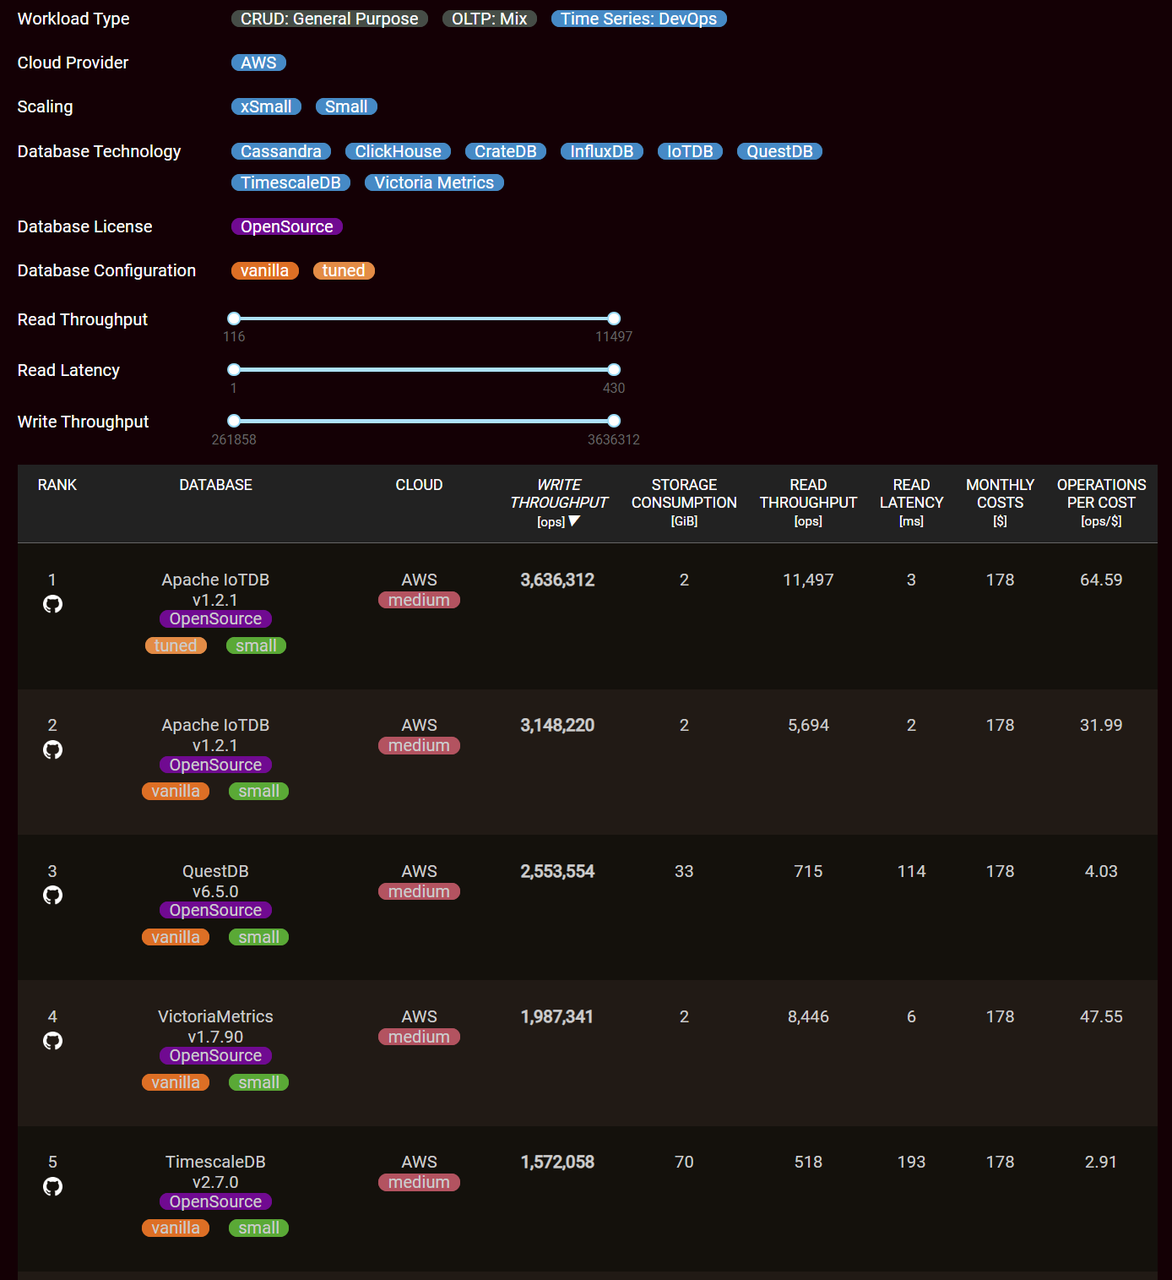
In terms of write, query, and storage performance, IoTDB performed exceptionally well. IoTDB's write throughput, calculated by importing 2,617,920,000 data points, achieved an impressive 3.63 million points per second. Compared to InfluxDB, TimescaleDB, and QuestDB, which are also featured on the benchANT ranking, IoTDB's write throughput was at least 1.4 times and up to 6.9 times higher.
Read latency: measured by querying "the aggregated value of 1 device's 1 measurement every 1 minute within 1 hour," demonstrated IoTDB's exceptional performance with a latency of only 2 milliseconds. In contrast to InfluxDB, TimescaleDB, and QuestDB on the benchANT ranking, IoTDB's query response speed ranged from 3 times to an astounding 96.5 times faster.
Storage consumption: recorded at the end of the query test, revealed that IoTDB utilized a mere 2 GiB of storage. In comparison to InfluxDB, TimescaleDB, and QuestDB on the benchANT ranking, IoTDB's storage consumption was 1/35th of the others.
Additionally, the ranking considered the hardware costs of AWS cloud servers and calculated the cost-effectiveness (Operations Per Cost) by dividing read throughput by monthly costs. This metric represents "how much read performance can be obtained per dollar spent." In this regard, IoTDB outperformed InfluxDB, TimescaleDB, and QuestDB by up to 22.2 times, and at least 1.4 times, showcasing its cost-effectiveness and superiority in terms of value for money.
The following chart illustrates a comparison of various performance testing metrics for mainstream time-series databases on the ranking:
The Timecho team conducted repeated tests on these database systems using the hardware environment and parameter configurations specified by benchANT to validate the results featured on the ranking.
1. Background
Based in Germany, benchANT focuses on evaluating cloud infrastructure and database performance. Recognizing the challenge users face when selecting databases without standardized performance and functionality benchmarks, benchANT conducts performance tests on various common relational, NoSQL, and time-series databases under unified hardware resources, identical system configurations, and fixed testing workloads. This ensures fairness in test results, and databases are ranked based on various metrics.
The current benchANT ranking includes 3 test scenarios:
"CRUD: General Purpose": This scenario primarily evaluates database CRUD operation performance using the YCSB test tool [2]. benchANT tested the performance of databases such as MySQL, PostgreSQL, and Cassandra under different workloads, measuring metrics like read and write latency and throughput.
"OLTP: Mix": This scenario mainly assesses database transaction performance using the Sysbench test tool [3]. benchANT tested MySQL and PostgreSQL performance under various workloads, measuring metrics like transactions per second and query latency.
"Time Series: DevOps": This scenario focuses on testing the read and write performance of time-series databases using the TSBS testing tool as a benchmark. The Time Series Benchmark Suite (TSBS), developed by Timescale [4], provides functionalities for generating time-series data, data ingestion, query generation, query execution, and automatic result aggregation. As an open-source project, TSBS is widely accepted by several time-series database systems, including InfluxDB (with its well-known InfluxDB tsdb design and InfluxDB tsdb metrics), TimescaleDB, VictoriaMetrics, QuestDB, and ClickHouse, among others. Many database vendors use this benchmark to generate performance reports, demonstrating the superior performance of their database systems. However, benchANT's time-series database performance testing ranking has made some modifications: benchANT uses the DevOps scenario from the TSBS suite, establishes uniform preset parameters (workloads, cluster sizes, etc.), and deploys various databases in the same Amazon Web Services (AWS) cloud environment to obtain objective test results. This scenario includes the following 6 metrics:
Write Throughput: The number of data points written per unit of time, indicating higher database write performance with higher values. Some solutions like IoTDB, known for strong IoTDB performance, are compared directly with other systems such as InfluxDB vs IoTDB to highlight ingestion efficiency.
Read Throughput: The number of query requests processed per unit of time, reflecting a database's ability to handle query requests. For Java-based ecosystems, the benchmark also helps evaluate Java TSDB implementations and their query responsiveness.
Read Latency: The response time for a single query, with lower values indicating faster query processing. Here, open source time series database cluster deployments often show varying latencies depending on replication strategies and query optimization.
Storage Consumption: The average disk usage recorded during testing, which is particularly relevant when considering IoTDB pricing and storage efficiency against other options.
Monthly Costs: Monthly expenses associated only with AWS machine costs.
Operations per Cost: Cost-effectiveness metric, indicating the number of operations performed per unit of expense, with higher values indicating greater cost-effectiveness.
2. Test Preparation
2.1 Software Versions
For this test, we used IoTDB version V1.2.1 [5], OpenJDK17 as the Java Development Kit (JDK), and the TSBS testing tool forked by benchANT from its GitHub repository [6].
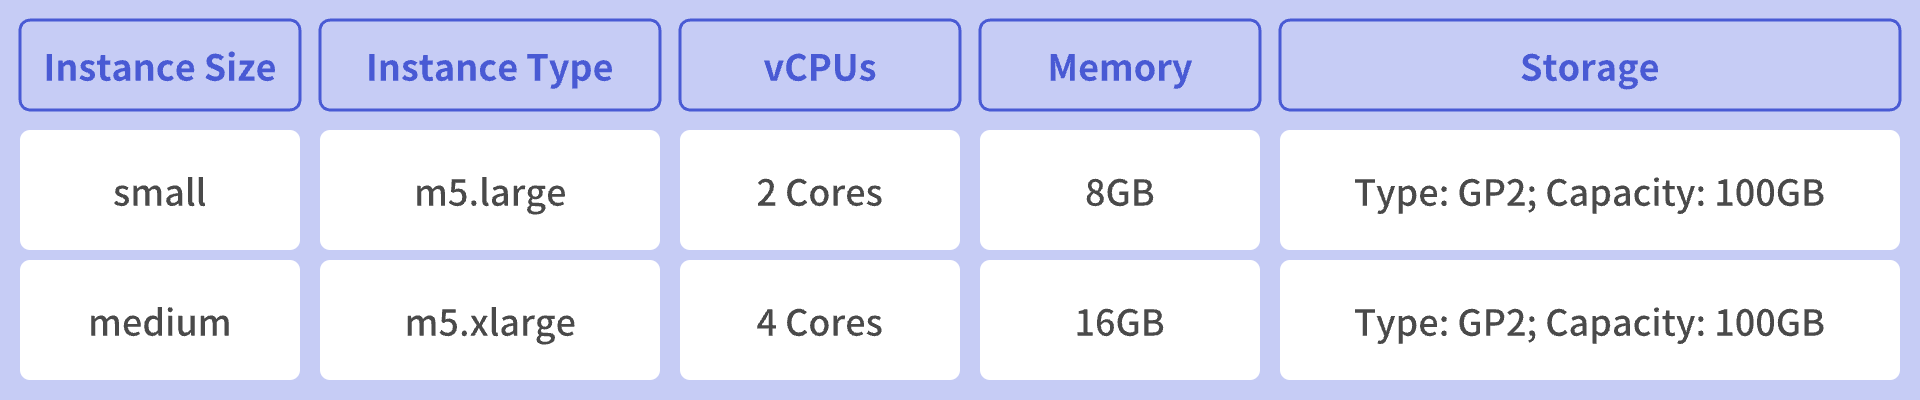
2.2 Hardware Resources and Configuration
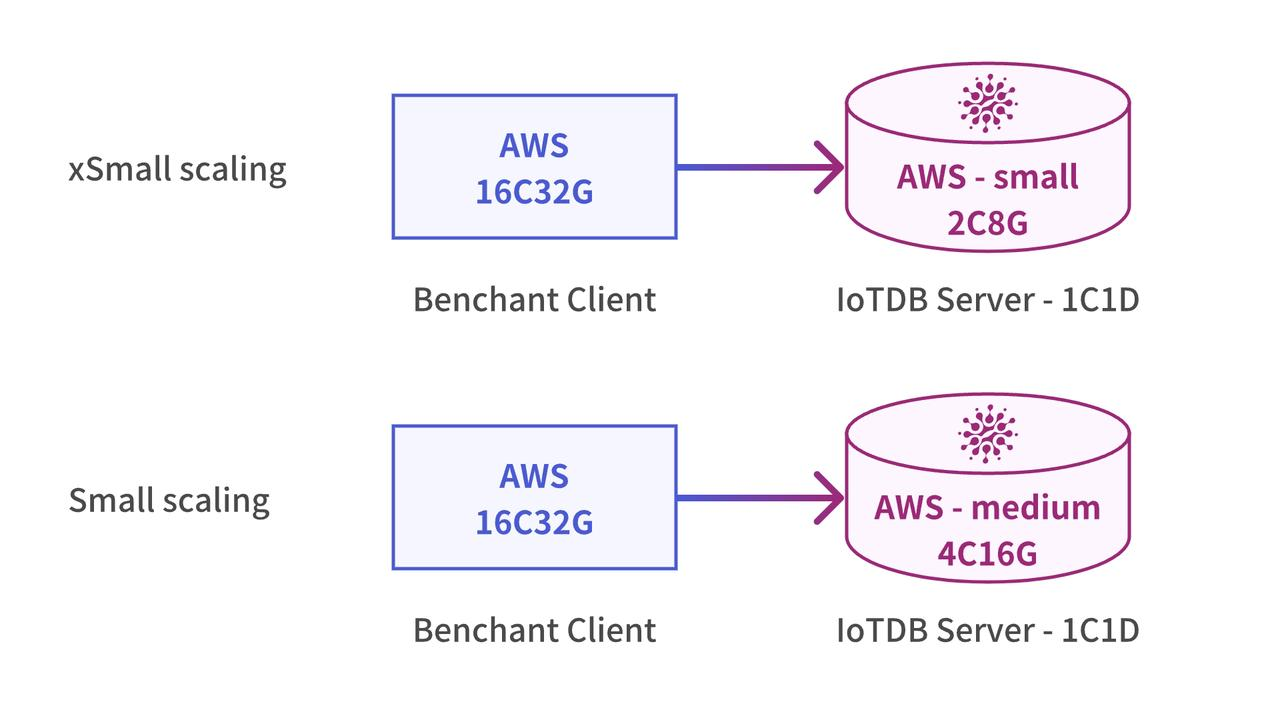
To ensure fairness and repeatability, benchANT executed all database tests on Amazon Web Services (AWS) EC2 instances using a standardized process to assess and generate evaluation results. In the case of time-series testing, benchANT distinguished between different test scales using the Scaling attribute, which describes the relationship between instance specifications and the cluster specifications for evaluating databases. This included the xSmall scaling for a small cluster (1 node) paired with a small instance size, and Small scaling for a small cluster (1 node) paired with a medium instance size. The configurations for small and medium instances were as follows:
Please notice that benchANT did not use large-scale clusters for time-series testing scenarios. In our actual testing, as machine specifications increased, IoTDB's resource scheduling became more fine-grained, allowing for greater performance. By constructing different scales, we could comprehensively evaluate the database's performance under various resource constraints.
Under xSmall scaling, benchANT clients utilized AWS EC2 c5.4xlarge instances with 16 cores and 32GB of RAM. IoTDB servers used AWS EC2 m5.large instances with 2 cores and 8GB of RAM. The deployment configuration for IoTDB was 1 ConfigNode and 1 DataNode. Under Small scaling, benchANT clients still used AWS EC2 c5.4xlarge instances with 16 cores and 32GB of RAM, while IoTDB servers used AWS EC2 m5.xlarge instances with 4 cores and 16GB of RAM. The deployment configuration for IoTDB remained 1 ConfigNode and 1 DataNode.
3. Testing Procedures
3.1 Modeling in IoTDB
In the testing process, the modeling in IoTDB is depicted as follows:
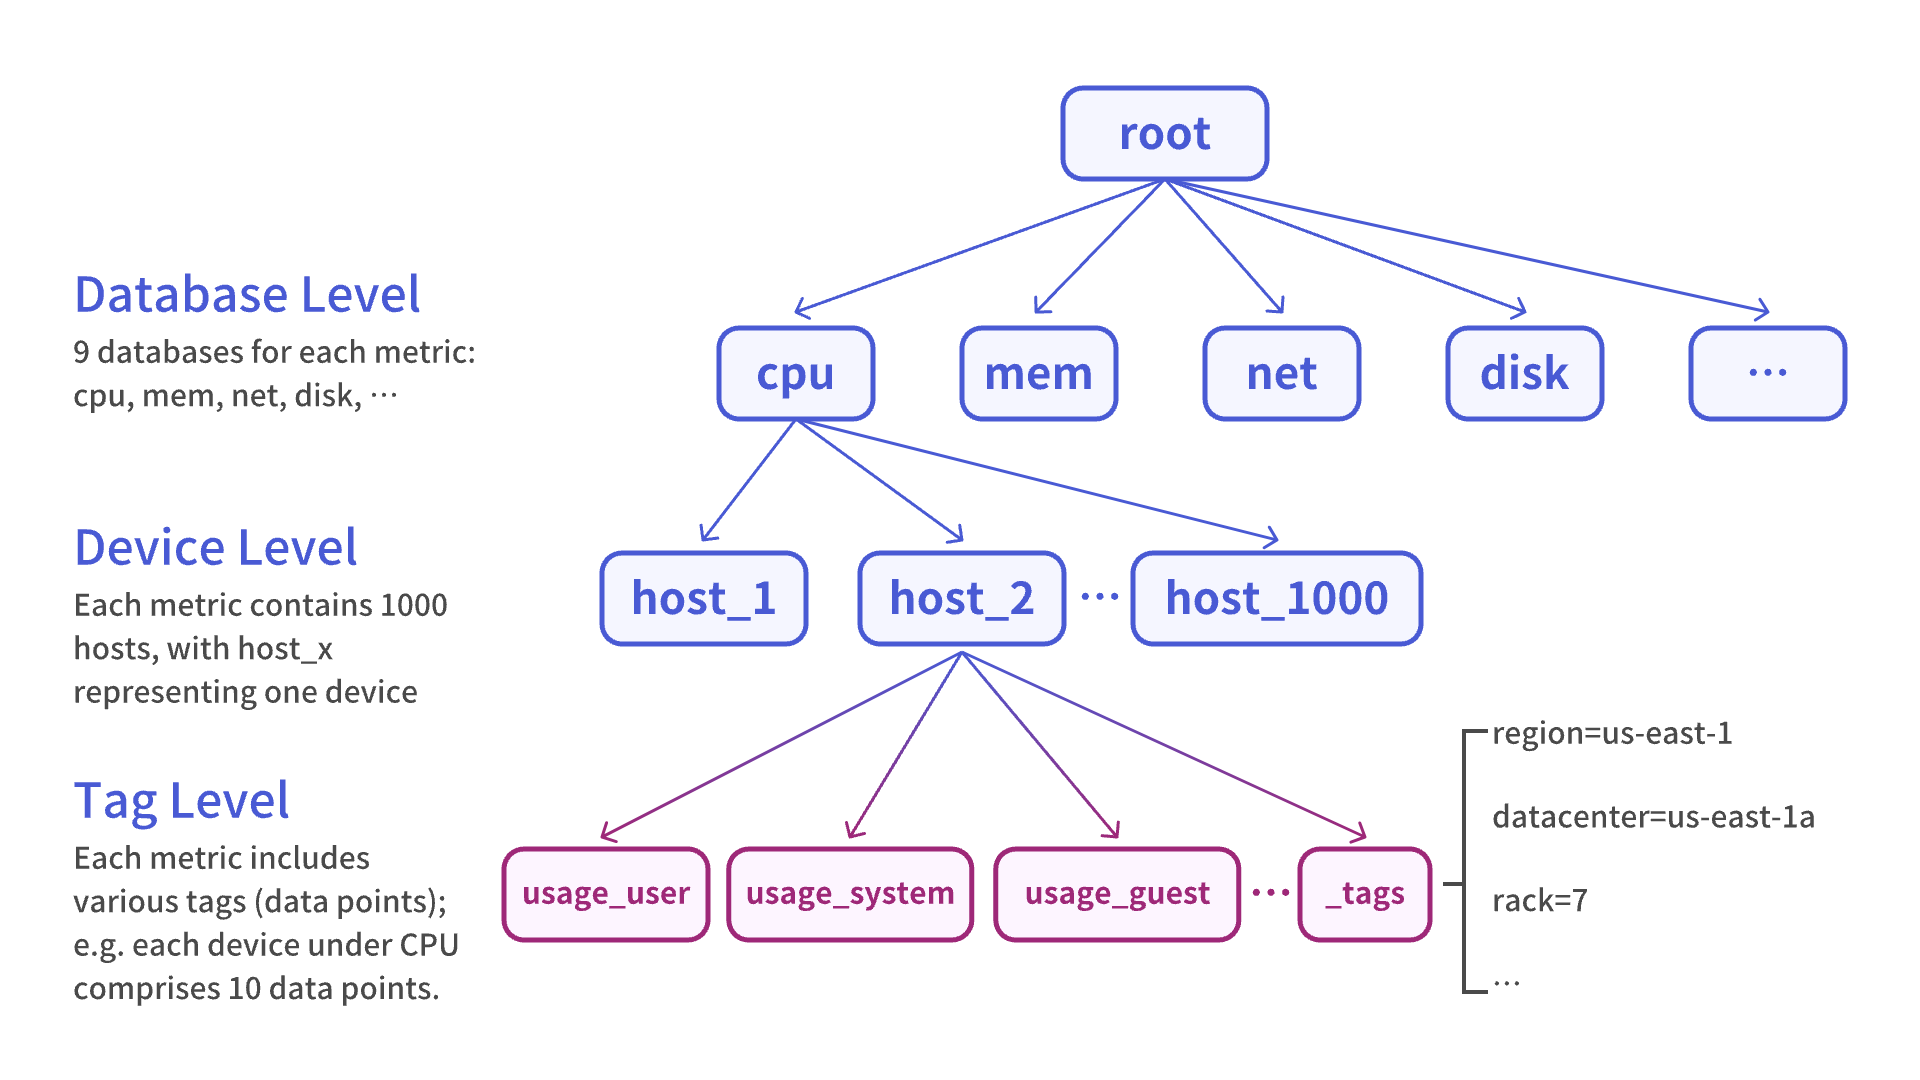
As mentioned, benchANT's testing utilizes the DevOps scenario from TSBS, which simulates monitoring data from running servers. Each running server (device) collects data from 9 major monitoring metrics (cpu, diskio, disk, kernel, mem, net, nginx, postgresl, redis).
The 9 major metrics are treated as 9 databases (DB), each containing 1,000 devices (representing 1,000 servers). The devices under each database have consistent data points, such as the cpu metric, which records 10 measurement values like usage_user, usage_system, usage_idle, etc. These measurement values have data types of INT, representing user-side CPU usage, system-side CPU usage, and so on. Similarly, the mem metric contains 9 measurement values with data types INT or DOUBLE, representing total memory, available memory, free memory, and more. In total, these 9 major monitoring metrics accumulate to 101 measurement values.
In addition to measurement values, each device also records its unique tags, which describe the device and remain constant over time. In benchANT's testing scenario, the device's tags information includes fields like region, datacenter, rack, os, arch, team, service, service_version, and service_environment. IoTDB stores tags data as a data point beneath the device and adds tags indexing on this data point.
In this modeling approach, each device is an aligned device, meaning that all data points under the device have "aligned" timestamps [7]. Using aligned devices helps improve write performance and reduce storage space consumption to some extent.
Furthermore, it's worth noting that for each database, all devices under that database have the same set of data points. This structure can also be optimized using IoTDB's "template" feature [8]. For example, for the cpu metric, you can create a cpu template called cpu_template in IoTDB:
create schema template cpu_template (
usage_user INT32, usage_system INT32, usage_idle INT32, usage_nice INT32, usage_iowait INT32, usage_irq INT32, usage_softirq INT32, usage_steal INT32, usage_guest INT32, usage_guest_nice INT32);
set schema template cpu_tempalte to root.cpu;
By mounting this template under the root.cpu hierarchy, all devices under root.cpu will contain the data points defined in the cpu_template. Using templates can help reduce the metadata space occupied by the database.
3.2 Write Performance
The test dataset was generated for 1,000 devices (servers) over a time range of 3 days (from 2022-07-25T00:00:00Z to 2022-07-28T00:00:00Z) with a data collection interval of 10 seconds. This dataset contains a total of 2,617,920,000 data points. benchANT calculated the write throughputs based on the time required to import these 2,617,920,000 data points.
The data writing phase involves numerous tunable parameters, and different parameter settings can significantly impact database performance. To ensure fair testing, benchANT used the following key parameters:
Workers: The number of concurrent client workers used by benchANT for data import. When the database is deployed on a 2C8GB instance, this value is set to 50. When the database is deployed on a 4C16GB instance, this value is set to 100.
HashWorkers: Controls the data writing forwarding rules. When set to true, it ensures that data from the same device is written by the same client, preventing data disorder. When set to false, data from each device is written by random clients, leading to some degree of data disorder. For benchANT's time series scenario tests, this value was set to false for all databases, making the results closer to real-world scenarios.
BatchSize: Specifies the number of data points included in a single write. For all time series database tests, this value was set to 1,000.
3.3 Query Performance
After the data import phase, benchANT performs query performance tests. For the DevOps scenario, TSBS provides various query types such as single-groupby-1-1-1 and single-groupby-1-1-12. However, in benchANT's testing framework, the evaluation is primarily based on the representative single-groupby-1-1-1 query type.
The single-groupby-1-1-1 query type involves querying the aggregated values of 1 metric for 1 host within 1 hour, segmented by 1 minute intervals. Referring to the "3.1 Modeling in IoTDB" section, an example SQL query statement for this IoTDB query type is:
SELECT MAX_VALUE(usage_user) FROM root.cpu.host_1 GORUP BY ([2022-07-25 00:00:00, 2022-07-25 01:00:00), 1h)In benchANT's testing, a total of 100,000 single-groupby-1-1-1 type query statements are generated. Each query statement randomly selects one device from among the 1,000 devices under the cpu metric and selects a one-hour time interval within the range from 2022-07-25T00:00:00Z to 2022-07-28T00:00:00Z as the query condition. After executing 100,000 queries, the query throughput and query latency information for the entire query phase are recorded. The key parameter in query testing is workers, representing the number of concurrent client workers during query execution, consistent with the workers parameter specified for data writing.
3.4 Command Set Scripts
In this section, we take the example of deploying IoTDB-Server on an AWS-Medium (4C16GB) machine with the IP address 172.31.8.255. After deploying IoTDB Server on AWS, users can execute the following four commands to perform tests and reproduce results.
3.4.1 Data Generation
nohup bin/tsbs_generate_data --use-case="devops" --seed=123 --scale=1000 \
  --timestamp-start="2022-07-25T00:00:00Z" \
  --timestamp-end="2022-07-28T00:00:00Z" \
  --log-interval="10s" --format="iotdb" \
  > iotdb-data-1000hosts-3days &
The meanings of the parameters are as follows:
use-case: Specifies the testing scenario, with options
devopsandiot. benchANT usesdevopsfor testing, simulating real-time monitoring data from servers.seed: Random number seed for data generation.
scale: The number of hosts/servers in the devops scenario, equivalent to the number of devices in IoTDB.
timestamp-start: The start time for generating the dataset.
timestamp-end: The end time for generating the dataset.
log-interval: The time interval between each data point.
format: Specifies the database format.
The generated dataset format is as shown below, where entries starting with 0 correspond to IoTDB's time series creation statements, and those starting with 1 represent data insertion statements.
0,cpu,host_3,tag,'hostname'='host_3','region'='us-east-1','datacenter'='us-east-1a','rack'='7','os'='Ubuntu16.04LTS','arch'='x64','team'='NYC','service'='19','service_version'='0','service_environment'='test'
1,cpu,host_3,1677628800000,55,20,15,61,30,19,20,5,16,65
3.4.2 Data Import
nohup cat iotdb-data-1000hosts-3days | bin/tsbs_load_iotdb \
--host="172.31.8.255" --port="6667" --user="root" --password="root" --timeout=1000 \
--workers=100 --batch-size=1000 > output.log 2>&1 &
The meanings of the parameters are as follows:
host: The address where IoTDB server is deployed. In this document, it is assumed to be
172.31.8.255.port: The port on which IoTDB server is deployed, with the default value of
6667.user: The username for connecting to IoTDB, with the default value of
root.password: The password for connecting to IoTDB, with the default value of
root.timeout: Timeout for executing requests in IoTDB.
workers: The number of concurrent client workers.
batch-size: The number of data rows forwarded by benchANT client in each batch.
3.4.3 Query Generation
bin/tsbs_generate_queries --use-case="devops" --seed=123 --scale=1000 \
    --timestamp-start="2022-07-25T00:00:00Z" \
    --timestamp-end="2022-07-28T00:00:00Z" \
    --queries=100000 --query-type="single-groupby-1-1-1" --format="iotdb" \
    > iotdb-queries.txt
The meanings of the parameters are as follows:
timestamp-start: The start time for querying the dataset.
timestamp-end: The end time for querying the dataset.
use-case: Specifies the testing scenario, consistent with the parameters used for data generation.
seed: Random number seed for data generation, consistent with the parameters used for data generation.
scale: The number of hosts/servers in the devops scenario, equivalent to the number of devices in IoTDB, consistent with the parameters used for data generation.
queries: The number of query test statements to generate.
query-type: Specifies the query type, as shown in the table below. benchANT's tests used the
single-groupby-1-1-1query type, which queries a single device's single metric aggregated in 1-hour segments by 1 minute. Example query statements generated:
SELECT MAX_VALUE(usage_user) FROM root.cpu.host_1 GROUP BY ([2022-07-25 00:00:00, 2022-07-25 01:00:00), 1h)After executing this command, a total of 100,000 query statements are generated. Each query statement randomly selects one device from among the 1,000 devices under the cpu metric and selects a one-hour time interval within the range from 2022-07-25T00:00:00Z to 2022-07-28T00:00:00Z as the query condition.
3.4.4 Executing Queries
cat iotdb-queries.txt | bin/tsbs_run_queries_iotdb \
--host="172.31.8.255" --port="6667" --user="root" --password="root" \
--workers=100 --print-responses=false --use-groupby=true
host: The address where IoTDB server is deployed. In this document, it is assumed to be
172.31.8.255.port: The port on which IoTDB server is deployed, with the default value of
6667.user: The username for connecting to IoTDB, with the default value of
root.password: The password for connecting to IoTDB, with the default value of
root.workers: The number of concurrent client workers.
print-responses: Whether to print query results.
use-groupby: Whether to use IoTDB GroupBy RPC interface.
To allow JIT to perform code compilation warming-up better, the above test statements can be executed three times with a 30-second interval between each execution.
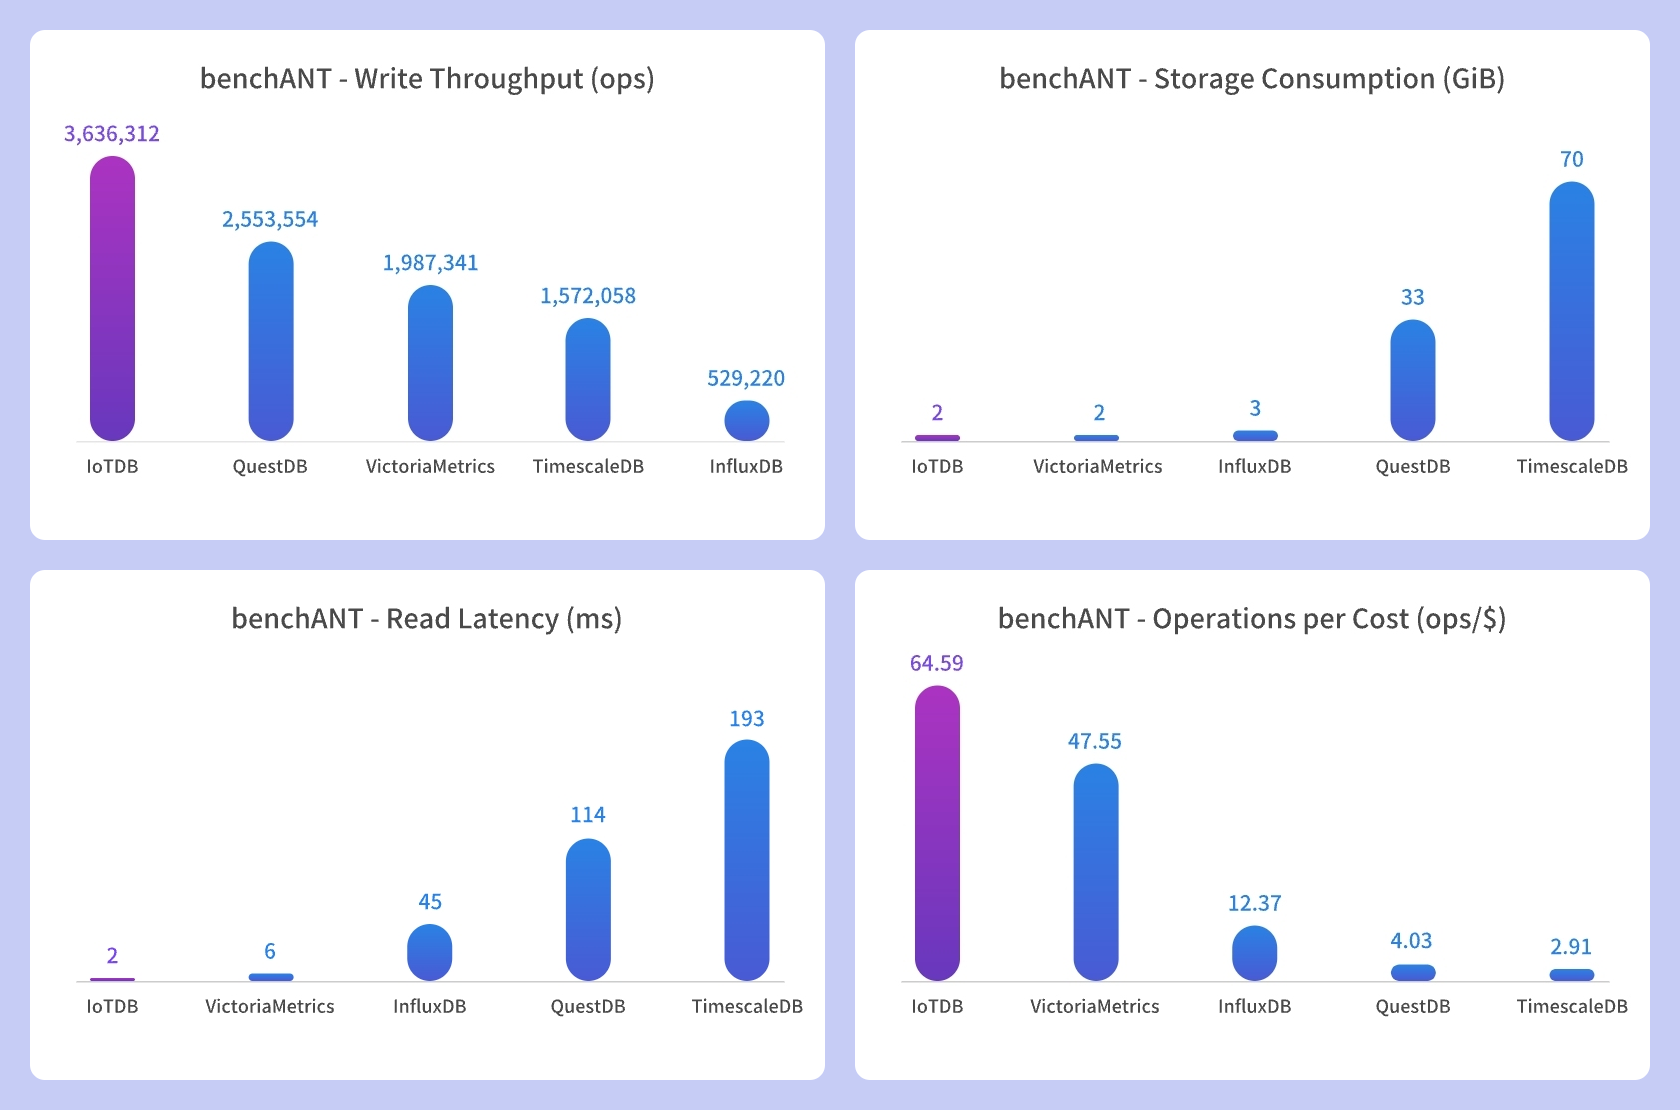
4. Performance Test Results and Analysis
4.1 Test Results
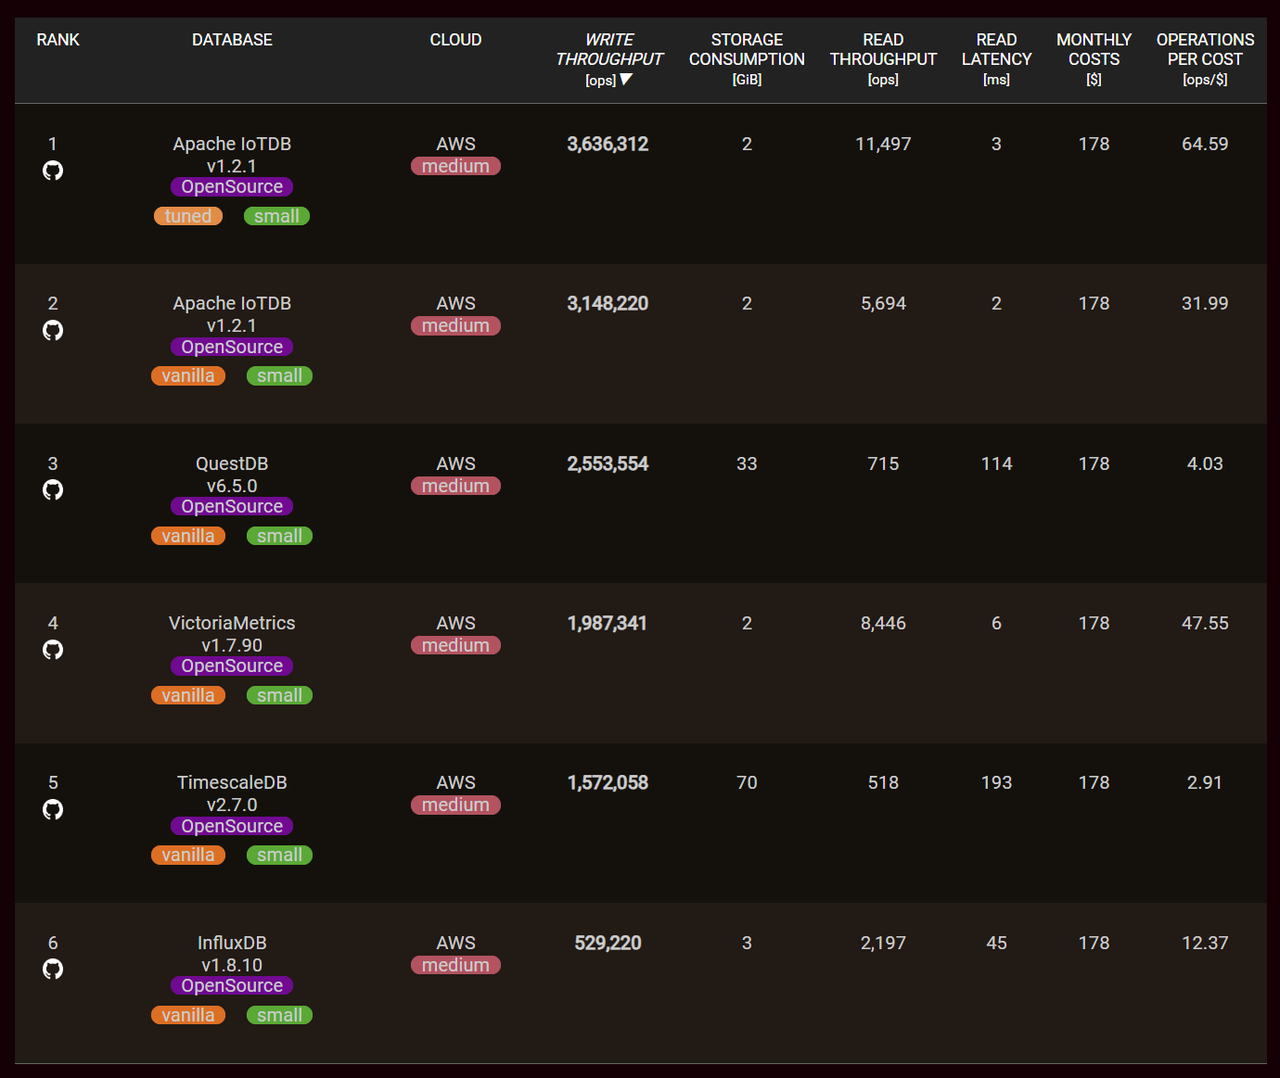
The following figures show benchANT's test rankings in the time series scenario. It is evident that IoTDB excels in read, write, and storage performance in both Small Scaling and xSmall Scaling environments, significantly outperforming other database products.
Test rankings in the Small Scaling environment:
Test rankings in the xSmall Scaling environment:
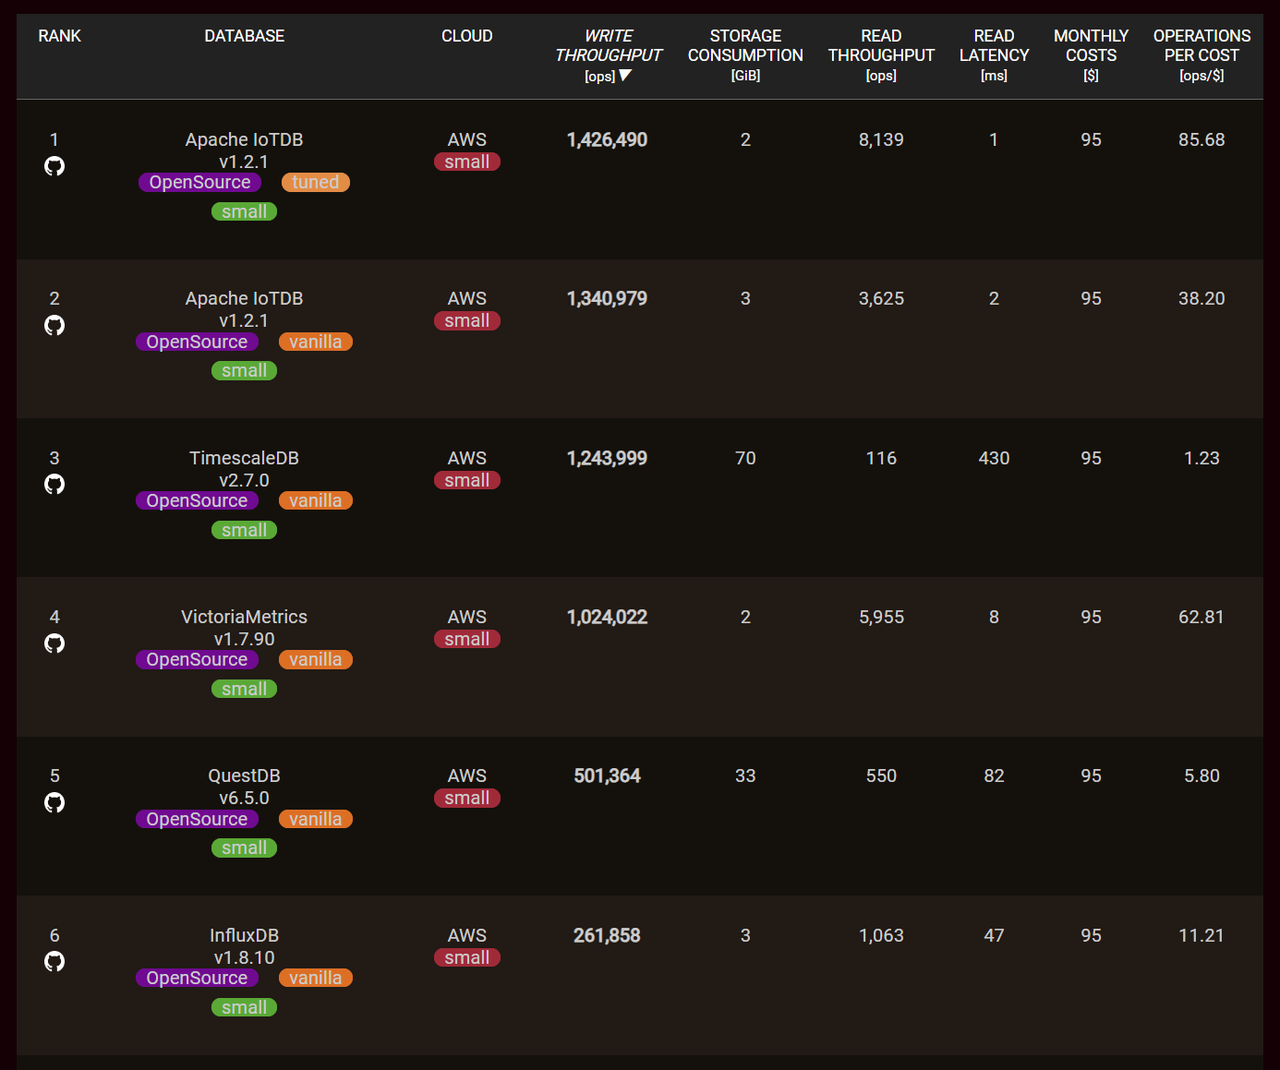
Write Throughput: This metric represents the number of data points processed per unit of time, indicating higher database write performance. In the
Small Scalingenvironment, IoTDB achieves a write throughput of 3,636,312 ops, surpassing InfluxDB by 6.9 times, TimescaleDB by 2.3 times, and QuestDB by 1.4 times. In thexSmall Scalingenvironment, IoTDB's write throughput is 1,426,490 ops, exceeding InfluxDB by 5.4 times, TimescaleDB by 1.1 times, and QuestDB by 2.8 times.Read Latency: This metric represents the response time of individual queries, with lower values indicating faster query processing. In the
Small Scalingenvironment, the query latency is 2ms, which is 23 times faster than InfluxDB, 97 times faster than TimescaleDB, and 57 times faster than QuestDB.. In thexSmall Scalingenvironment, the query latency is 1ms, outperforming InfluxDB 47 times, TimescaleDB 430 times, and QuestDB 82 times.Storage Consumption: This metric represents the storage space used, recording the average disk usage during the test run. In both
Small ScalingandxSmall Scalingenvironments, IoTDB's storage space usage is 2GB, ranking at the top. This demonstrates IoTDB's ability of enabling extreme high compression ratio.Operations per Cost: A higher value is better because IoTDB can execute the most write and query requests per unit cost. Therefore, IoTDB ranks first in cost-effectiveness.
4.2 Performance Analysis
In the benchANT tests, IoTDB provides two versions of configuration parameters: Vanilla and Tuned. Vanilla uses the default IoTDB configuration file with only the maximum heap memory size of Java modified. Tuned, on the other hand, offers advanced parameters that adapt database parameters based on machine specifications and test loads.
The table below provides an example of IoTDB's parameters in the Small Scaling environment (4 cores, 16GB, single-machine deployment) for both Vanilla and Tuned versions. By comparing these parameters, users can understand common tuning directions for IoTDB.
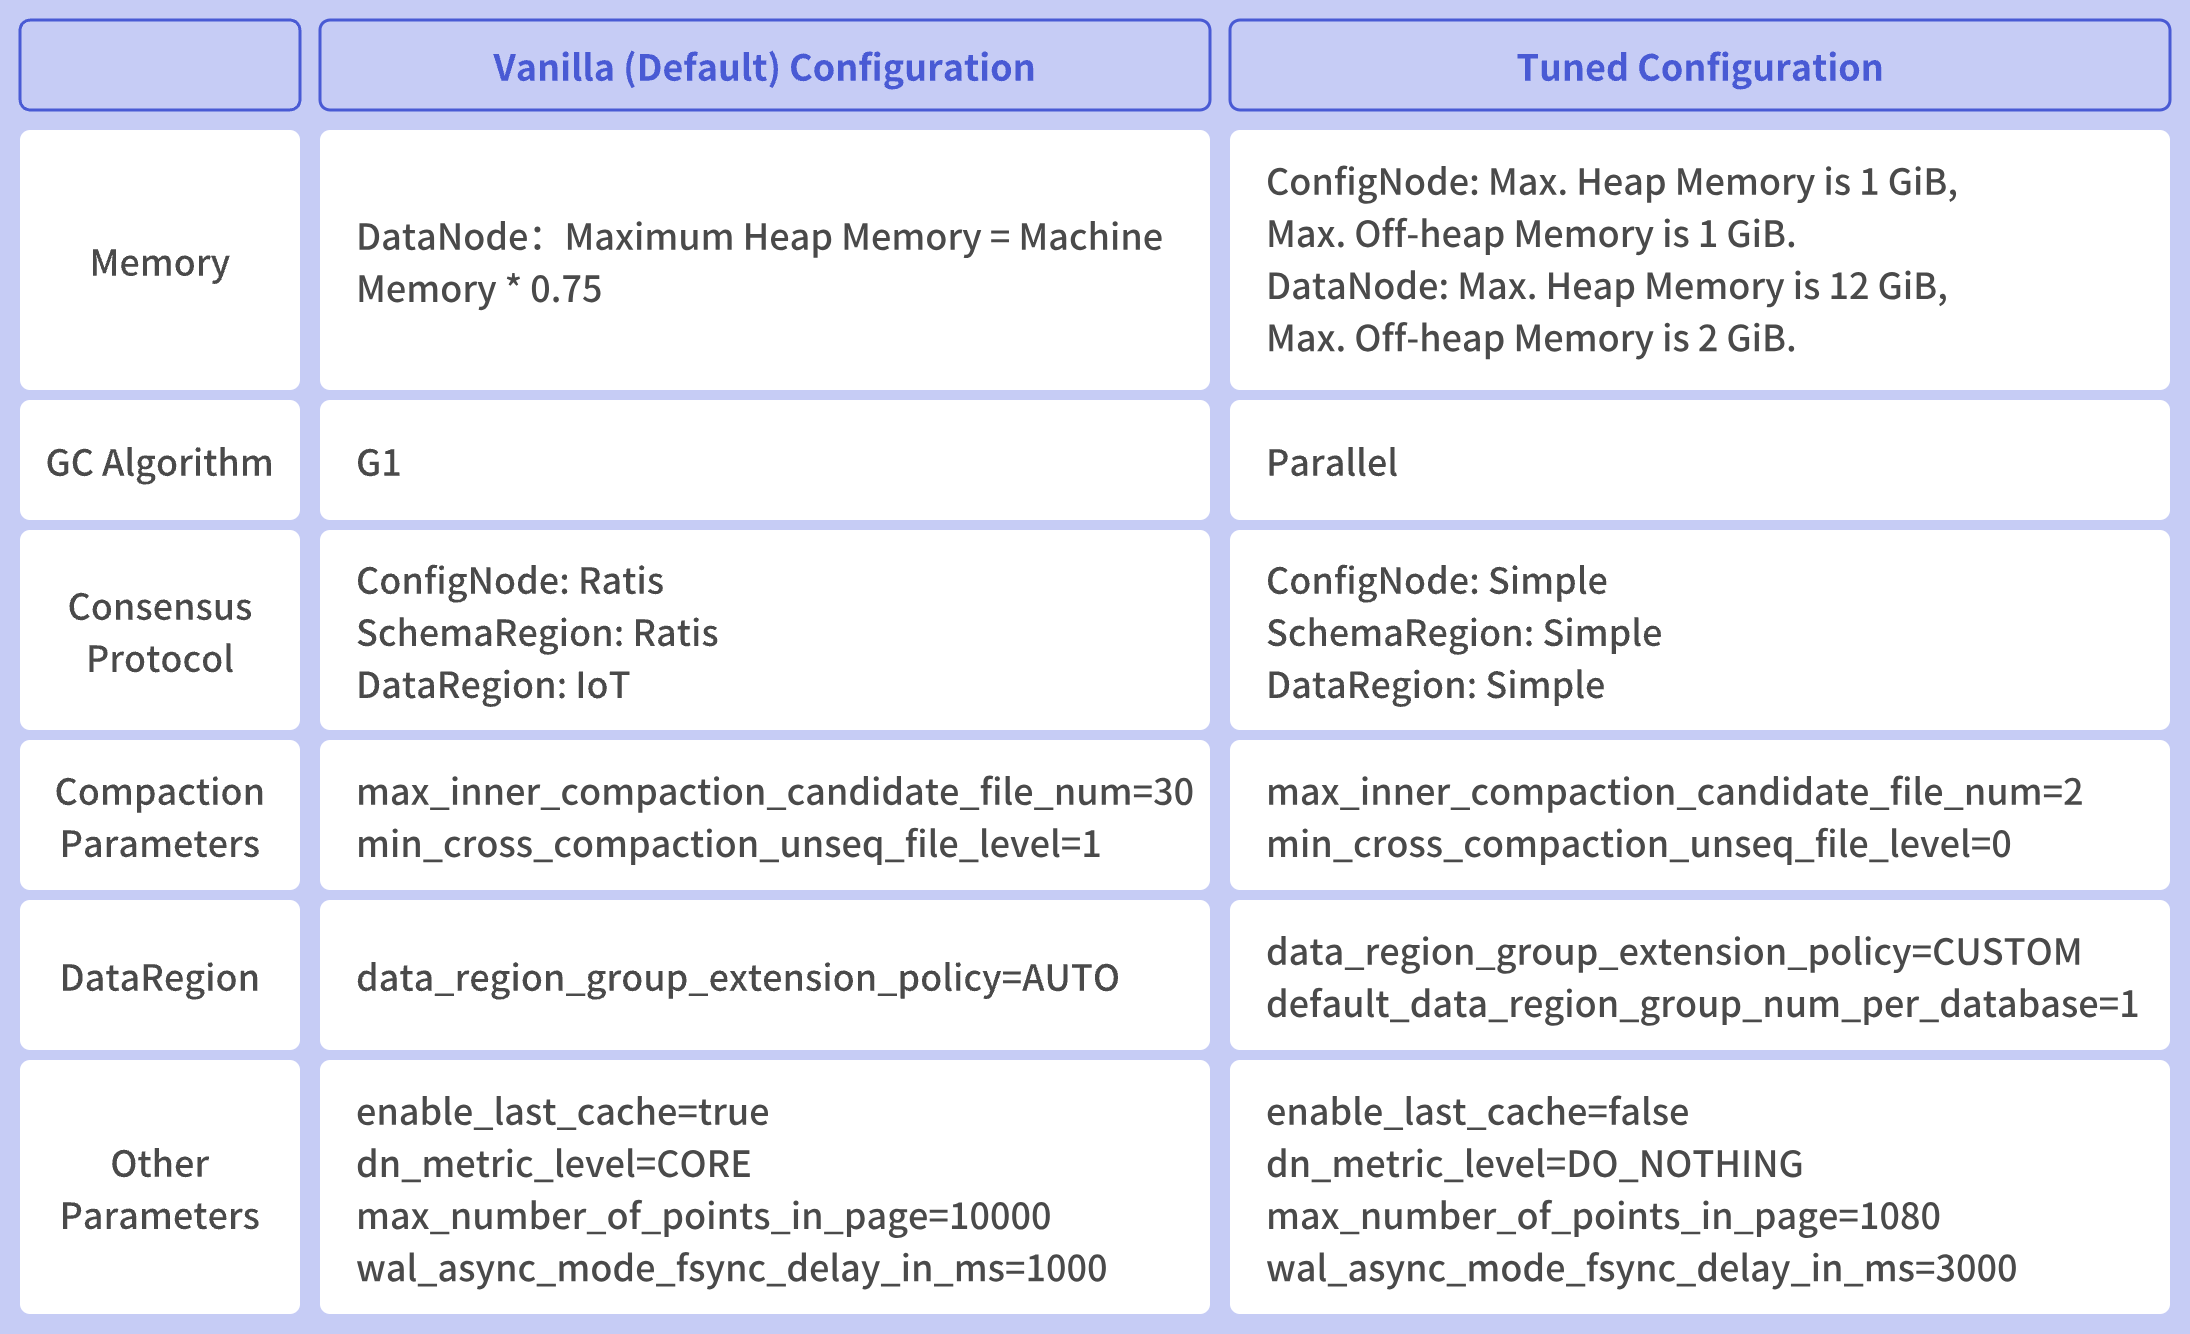
Memory Parameters: In the Vanilla environment, only the maximum heap memory of DataNode is set to machine memory * 0.75, which is relatively simple. In the Tuned environment, more detailed memory allocation is performed for ConfigNode and DataNode. ConfigNode stores cluster-wide data, which typically occupies less space, so it is allocated less memory. DataNode, which stores real-time series metadata and data, occupies more space, so it is allocated more memory.
GC Algorithm: JDK17 defaults to the G1 garbage collection (GC) algorithm, which prioritizes recycling efficiency. In benchANT's evaluation, throughput (write throughput, query throughput, etc.) is a crucial database performance metric. Therefore, the GC algorithm can be adjusted to the Parallel GC algorithm, which focuses more on throughput.
Consensus Protocol: The
xSmallandSmallscenarios tested by benchANT both involve single-machine deployments, while IoTDB's default consensus protocol,Ratis, is mainly designed for distributed clusters. For single-machine deployments, theSimpleconsensus protocol is sufficient.Merge Parameters: One of the evaluation metrics in benchANT testing is
storage consumption, which is calculated after the query evaluation phase. To achieve lowerstorage consumption, IoTDB-Tuned increases the merging strength appropriately, allowing data merging to be completed in less time.Data Partitioning Parameters: In benchANT testing, IoTDB creates 9 databases for modeling. As the testing machine specifications are relatively small, allocating one data region per database provides sufficient parallelism. When machine specifications are upgraded, the
default_data_region_group_num_per_databaseparameter can be adjusted to increase write and query parallelism.Other Parameters: This section lists parameters that have a relatively small impact on IoTDB's performance.
enable_last_cachecontrols whether to enable the last cache. Since benchANT query tests do not include queries for the latest values, the last cache functionality can be disabled. IoTDB uses an efficient last cache algorithm, so this parameter has a relatively small impact on write performance.dn_metric_levelis an IoTDB metric monitoring level, mainly used for online issue troubleshooting. Collecting monitoring data can slightly increase CPU usage, so it can be disabled in benchANT testing.max_number_of_points_in_pagecontrols the number of data points in a TsFile Page. Typically, a higher number of data points results in better data compression. The number of data points in a Page also affects query performance. Since benchANT's query tests only query points within a 1-hour range,Tunedsets this value to an appropriate number, considering both compression ratio and query performance.wal_async_mode_fsync_delay_in_mscontrols the frequency of WAL module invokingfsyncto ensure data durability. IoTDB-WAL usesfsyncmode by default, withfsync_delayset to 1 second. Generally, a higherfsyncfrequency consumes more IO resources and has a greater impact on write performance. Due to IoTDB's batch write optimizations, the impact of fsync frequency on write performance is relatively small. Therefore, in theTunedenvironment,fsync_delayis set to 3 seconds to meet the requirements.
5. Conclusion
From the test results, it is evident that IoTDB efficiently utilizes machine performance, demonstrating high write efficiency, whether on small or large machines. As hardware specifications improve, IoTDB's write performance also significantly improves, outpacing other database systems by a wider margin.
While maintaining high write performance, IoTDB excels in query performance, outperforming other databases by tenfold or even a hundredfold. IoTDB provides rich encoding and compression algorithms, making it adaptable to various data types and distributions. In benchANT testing, INT data types use TS_2DIFF encoding, DOUBLE data types use GORILLA encoding, and LZ4 compression is used. This combination achieves both high compression ratios and high write and query performance, confirming IoTDB's "efficient read/write, extreme compression" capabilities.
benchANT's results for time series database testing demonstrate Apache IoTDB's robust performance and significant advantages compared to other database systems.
6. References
[1] The benchANT Database Ranking, https://benchant.com/en/ranking/database-ranking
[2] Yahoo! Cloud Serving Benchmark, https://github.com/brianfrankcooper/YCSB
[3] Scriptable database and system performance benchmark, https://github.com/akopytov/sysbench
[4] Timescale: You are what you benchmark: Introducing the Time Series Benchmark Suite (TSBS), https://www.timescale.com/blog/time-series-database-benchmarks-timescaledb-influxdb-cassandra-mongodb-bc702b72927e/
[5] Apache IoTDB Release Version, https://iotdb.apache.org/Download/
[6] Time Series Benchmark Suite forked by benchANT, https://github.com/benchANT/tsbs
[7] Timecho: Data Model, https://www.timecho-global.com/docs/UserGuide/V1.2.x/Basic-Concept/Data-Model-and-Terminology.html#path
[8] Timecho: Operate Metadata, https://www.timecho-global.com/docs/UserGuide/V1.2.x/User-Manual/Operate-Metadata.html#operate-metadata


