
Workbench Deployment
Workbench Deployment
The visualization console is one of the supporting tools for IoTDB (similar to Navicat for MySQL). It is an official application tool system used for database deployment implementation, operation and maintenance management, and application development stages, making the use, operation, and management of databases simpler and more efficient, truly achieving low-cost management and operation of databases. This document will assist you in installing Workbench.
The instructions for using the visualization console tool can be found in the Instructions section of the document.
1. Installation Preparation
| Preparation Content | Name | Version Requirements | Link |
|---|---|---|---|
| Operating System | Windows or Linux | - | - |
| Installation Environment | JDK | v1.5.4 and below require ≥ 1.8; v1.5.5 and above require ≥ 17. Choose the ARM or x64 installer according to your system. | https://www.oracle.com/java/technologies/downloads/ |
| Related Software | Prometheus | Requires installation of V2.30.3 and above. | https://prometheus.io/download/ |
| Database | IoTDB | Requires V1.2.0 Enterprise Edition and above | You can contact business or technical support to obtain |
| Console | IoTDB-Workbench-<version> | - | You can choose according to the appendix version comparison table and contact business or technical support to obtain it |
Pre-installation Check
To ensure the Workbench installation package you obtained is complete and valid, we recommend performing an SHA512 verification before proceeding with the installation and deployment.
Preparation:
- Obtain the officially released SHA512 checksum: Contact the Timecho Team to get it.
Verification Steps (Linux as an Example):
- Open the terminal and navigate to the directory where the installation package is stored (e.g., /data/workbench):
cd /data/workbench - Execute the following command to calculate the hash value:
sha512sum IoTDB-Workbench-`<version>`.zip - The terminal will output a result (the left part is the SHA512 checksum, and the right part is the file name):
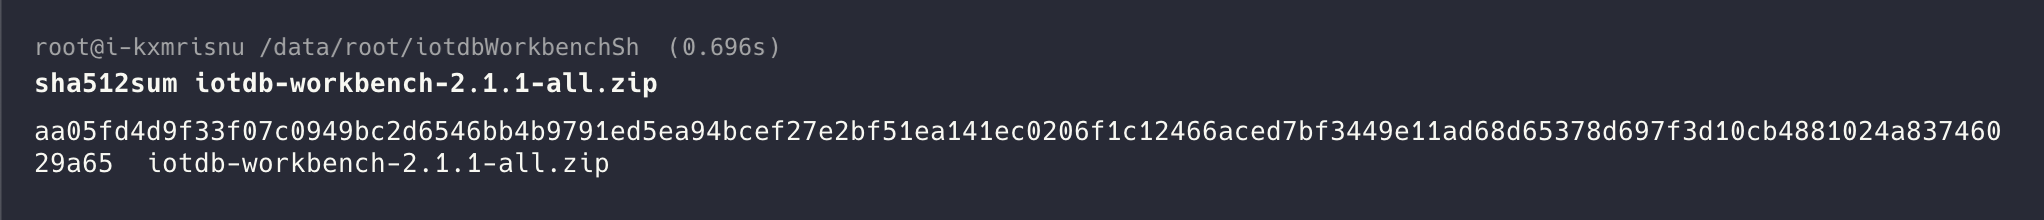
- Compare the output result with the official SHA512 checksum. Once confirmed that they match, you can proceed with the installation and deployment operations in accordance with the procedures below.
Notes:
- If the verification results do not match, please contact the Timecho Team to re-obtain the installation package.
- If a "file not found" prompt appears during verification, check whether the file path is correct or if the installation package has been fully downloaded.
2. Installation Steps
2.1 IoTDB enables monitoring indicator collection
- Open the monitoring configuration item. The configuration items related to monitoring in IoTDB are disabled by default. Before deploying the monitoring panel, you need to open the relevant configuration items (note that the service needs to be restarted after enabling monitoring configuration).
| Configuration | Located in the configuration file | Description |
|---|---|---|
| cn_metric_reporter_list | conf/iotdb-system.properties | Please add this configuration item to the configuration file and set the value to PROMETHEUS |
| cn_metric_level | Please add this configuration item to the configuration file and set the value to IMPORTANT | |
| cn_metric_prometheus_reporter_port | Please add this configuration item to the configuration file to maintain the default setting of 9091. If other ports are set, they will not conflict with each other | |
| dn_metric_reporter_list | conf/iotdb-system.properties | Please add this configuration item to the configuration file and set the value to PROMETHEUS |
| dn_metric_level | Please add this configuration item to the configuration file and set the value to IMPORTANT | |
| dn_metric_prometheus_reporter_port | Please add this configuration item to the configuration file and set it to 9092 by default. If other ports are set, they will not conflict with each other | |
| dn_metric_internal_reporter_type | Please add this configuration item to the configuration file and set the value to IOTDB | |
| enable_audit_log | conf/iotdb-system.properties | Please add this configuration item to the configuration file and set the value to true |
| audit_log_storage | Please add this configuration item in the configuration file, with values set to IOTDB and LOGGER | |
| audit_log_operation | Please add this configuration item in the configuration file, with values set to DML,DDL,QUERY |
Restart all nodes. After modifying the monitoring indicator configuration of three nodes, the confignode and datanode services of all nodes can be restarted:
# Unix/OS X
./sbin/stop-standalone.sh      #Stop confignode and datanode first
./sbin/start-confignode.sh  -d #Start confignode
./sbin/start-datanode.sh  -d   #Start datanode

# Windows
# Before version V2.0.4.x
.\sbin\stop-standalone.bat
.\sbin\start-confignode.bat
.\sbin\start-datanode.bat

# V2.0.4.x and later versions
.\sbin\windows\stop-standalone.bat
.\sbin\windows\start-confignode.bat
.\sbin\windows\start-datanode.bat
After restarting, confirm the running status of each node through the client. If the status is Running, it indicates successful configuration:

2.2 Install and configure Prometheus
Download the Prometheus installation package, which requires installation of V2.30.3 and above. You can go to the Prometheus official website to download it (https://prometheus.io/docs/introduction/first_steps/)
Unzip the installation package and enter the unzipped folder:
tar xvfz prometheus-*.tar.gz
cd prometheus-*
Modify the configuration. Modify the configuration file prometheus.yml as follows
- Add configNode task to collect monitoring data for ConfigNode
- Add a datanode task to collect monitoring data for DataNodes
global:
scrape_interval: 15s
evaluation_interval: 15s
scrape_configs:
- job_name: "prometheus"
    static_configs:
    - targets: ["localhost:9090"]
- job_name: "confignode"
    static_configs:
    - targets: ["iotdb-1:9091","iotdb-2:9091","iotdb-3:9091"]
    honor_labels: true
- job_name: "datanode"
    static_configs:
    - targets: ["iotdb-1:9092","iotdb-2:9092","iotdb-3:9092"]
    honor_labels: true
Start Prometheus. The default expiration time for Prometheus monitoring data is 15 days. In production environments, it is recommended to adjust it to 180 days or more to track historical monitoring data for a longer period of time. The startup command is as follows:
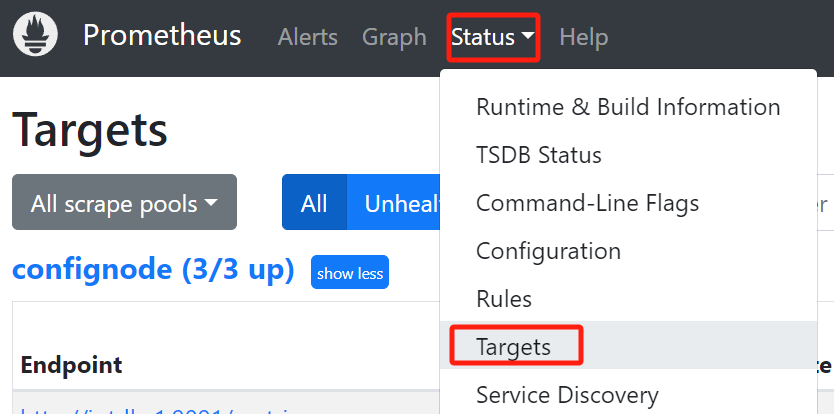
./prometheus --config.file=prometheus.yml --storage.tsdb.retention.time=180dConfirm successful startup. Enter in browser
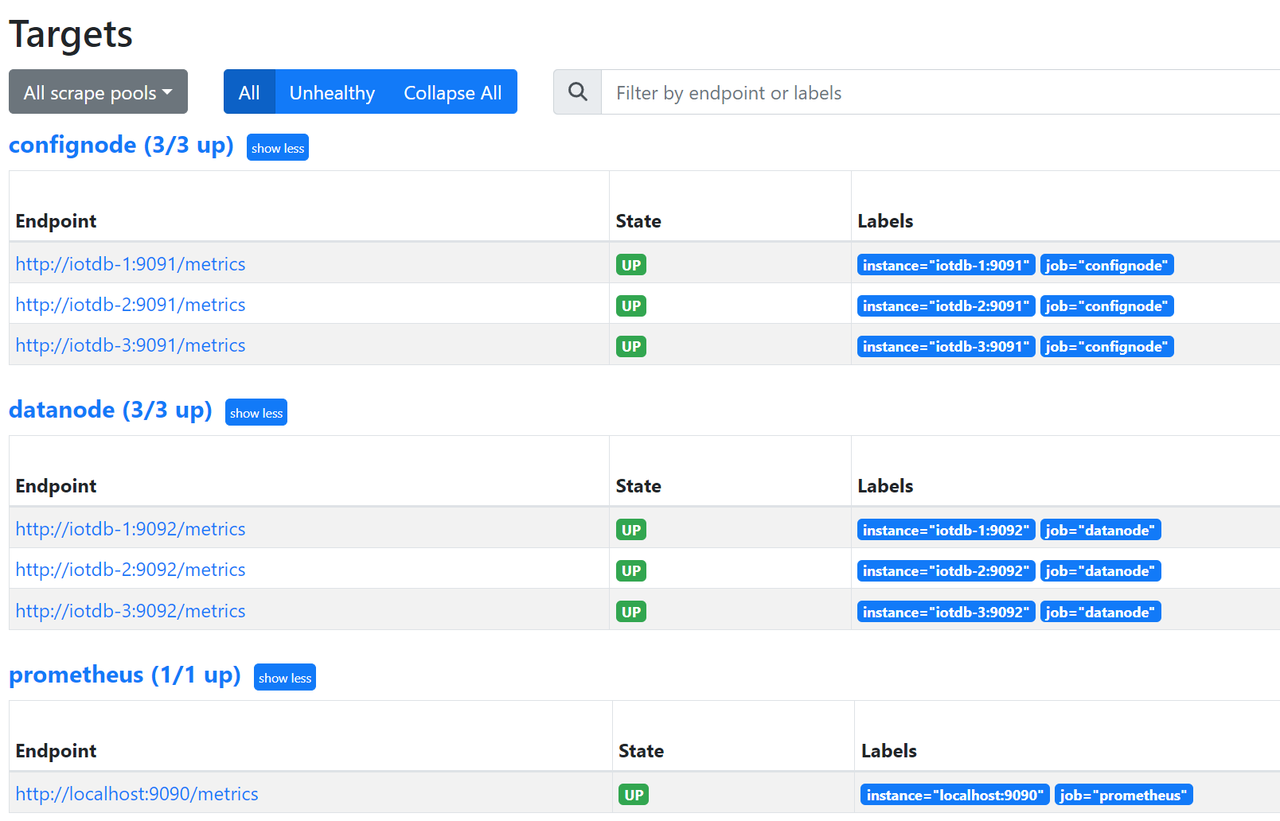
http://IP:portGo to Prometheus and click on the Target interface under Status. When you see that all States are Up, it indicates successful configuration and connectivity.
2.3 Install Workbench
Enter the config directory of iotdb Workbench -
<version>Modify Workbench configuration file: Go to the
configfolder and modify the configuration fileapplication-prod.properties. If you are installing it locally, there is no need to modify it. If you are deploying it on a server, you need to modify the IP addressWorkbench can be deployed on a local or cloud server as long as it can connect to IoTDB
Configuration Before Modification After modification pipe.callbackUrl pipe.callbackUrl= http://127.0.0.1pipe.callbackUrl= http://<Workbench's IP address>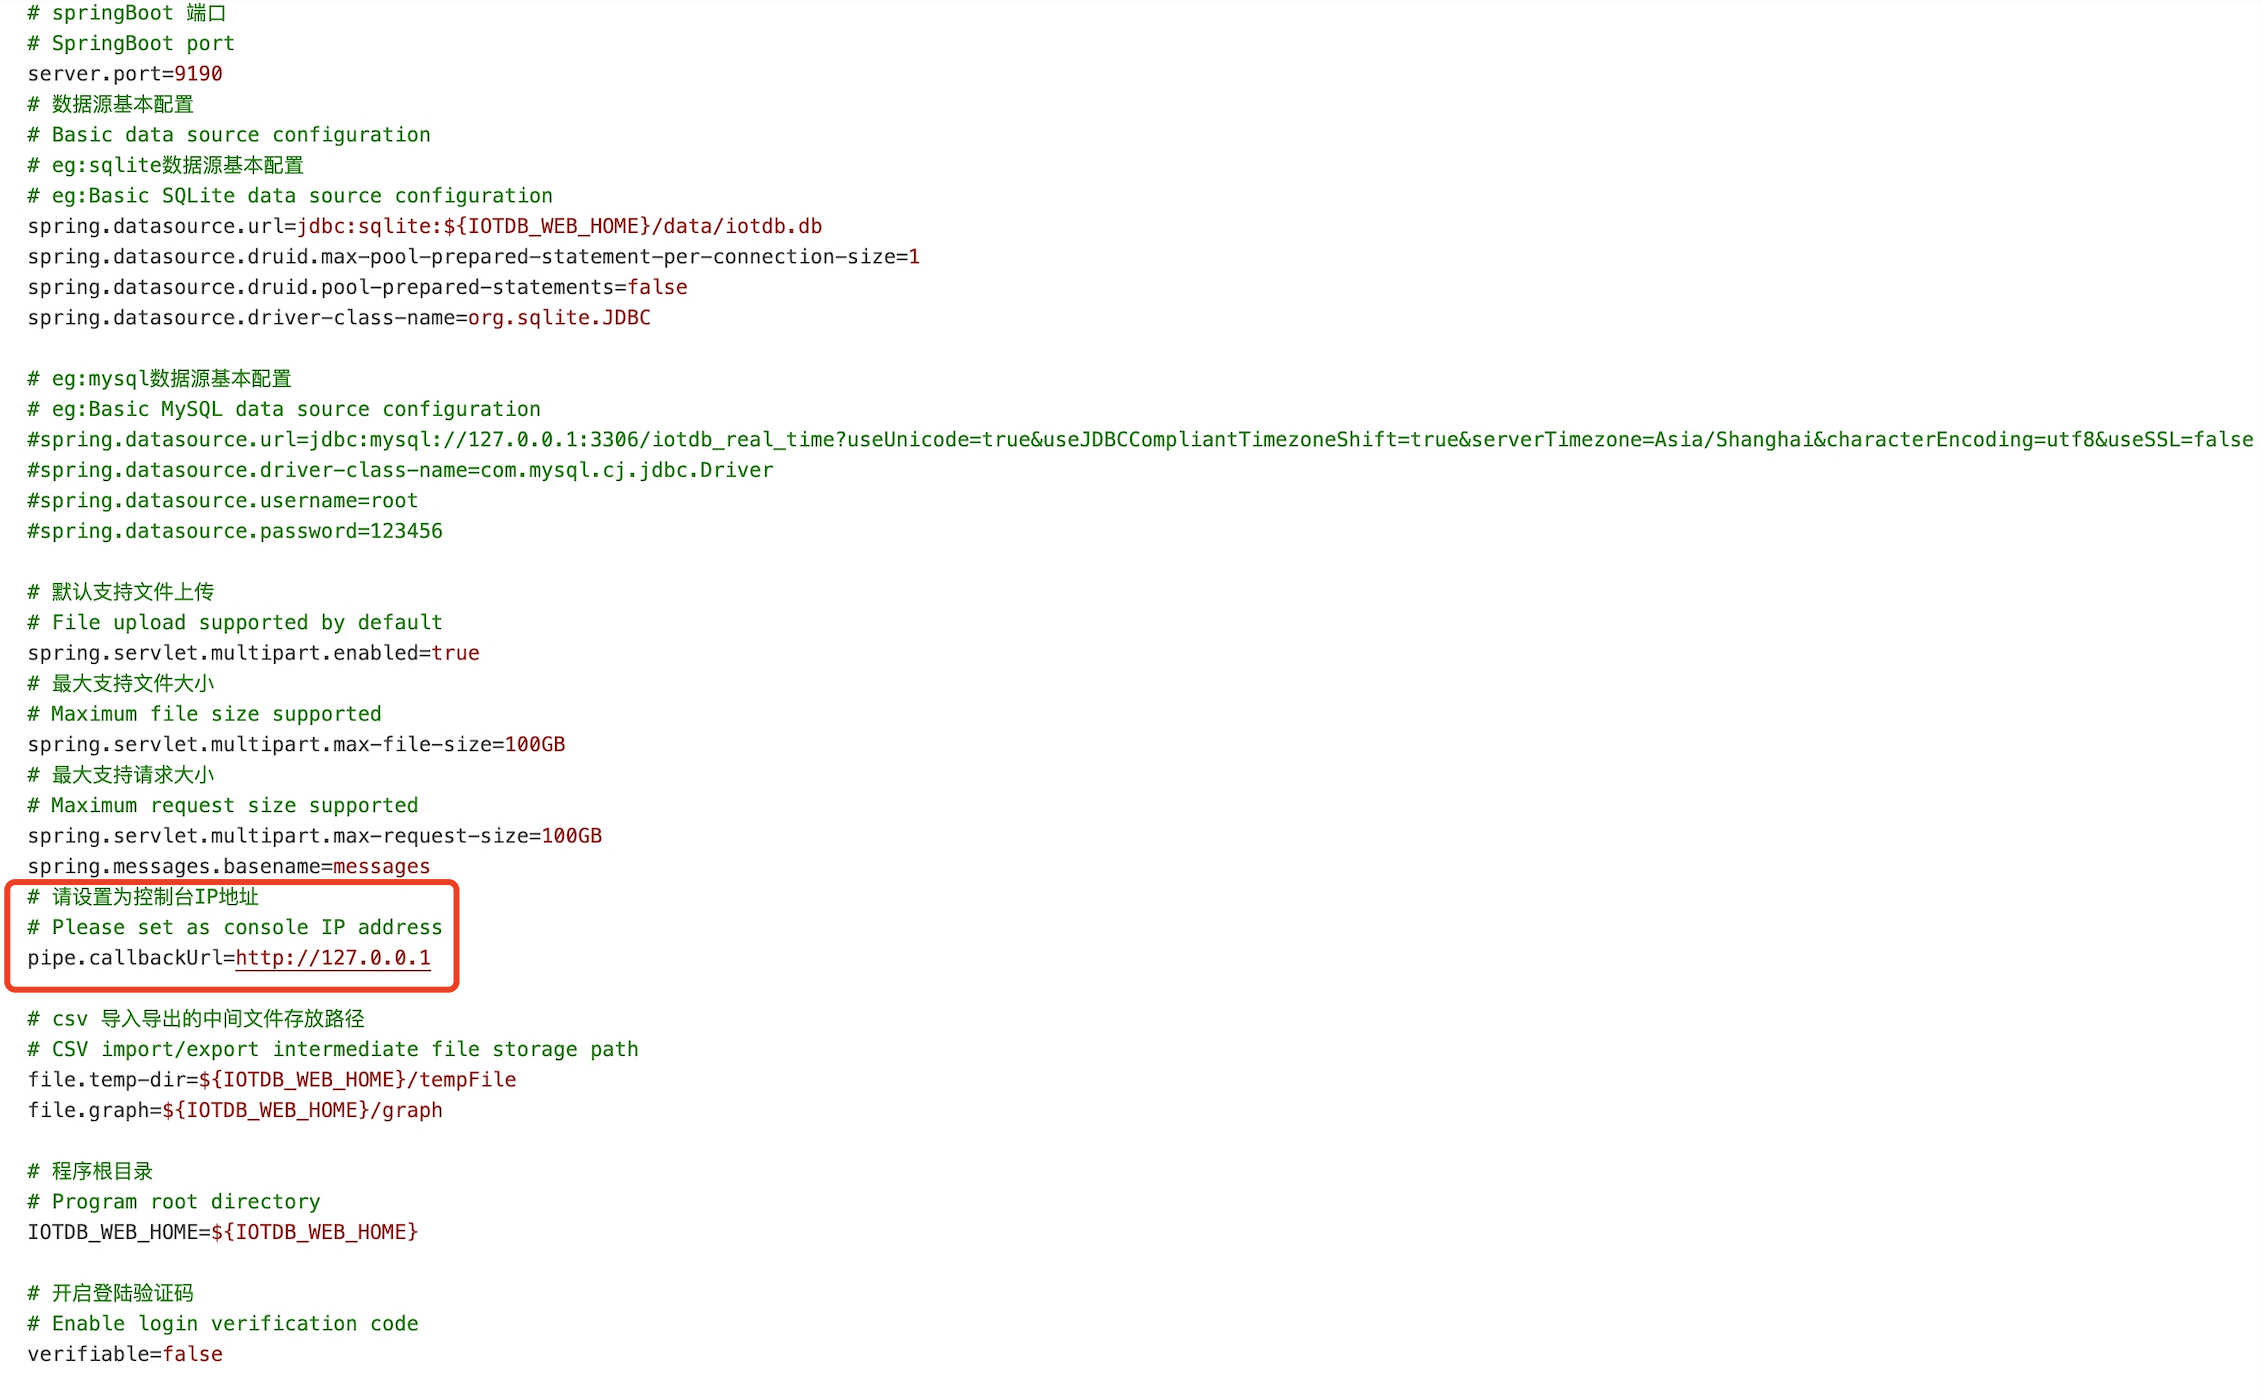
Startup program: Please execute the startup command in the sbin folder of IoTDB Workbench -
<version>
Windows:# Start Workbench in the background start.bat -dLinux:
# Start Workbench in the background
./start.sh -d
You can use the
jpscommand to check if the startup was successful, as shown in the figure: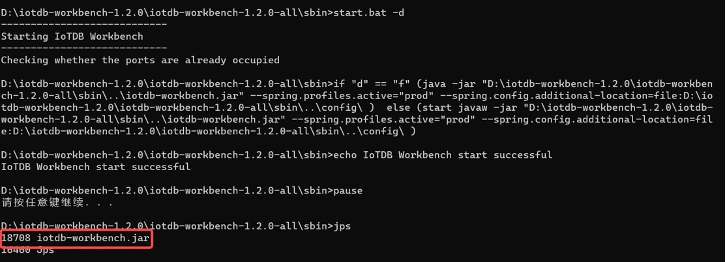
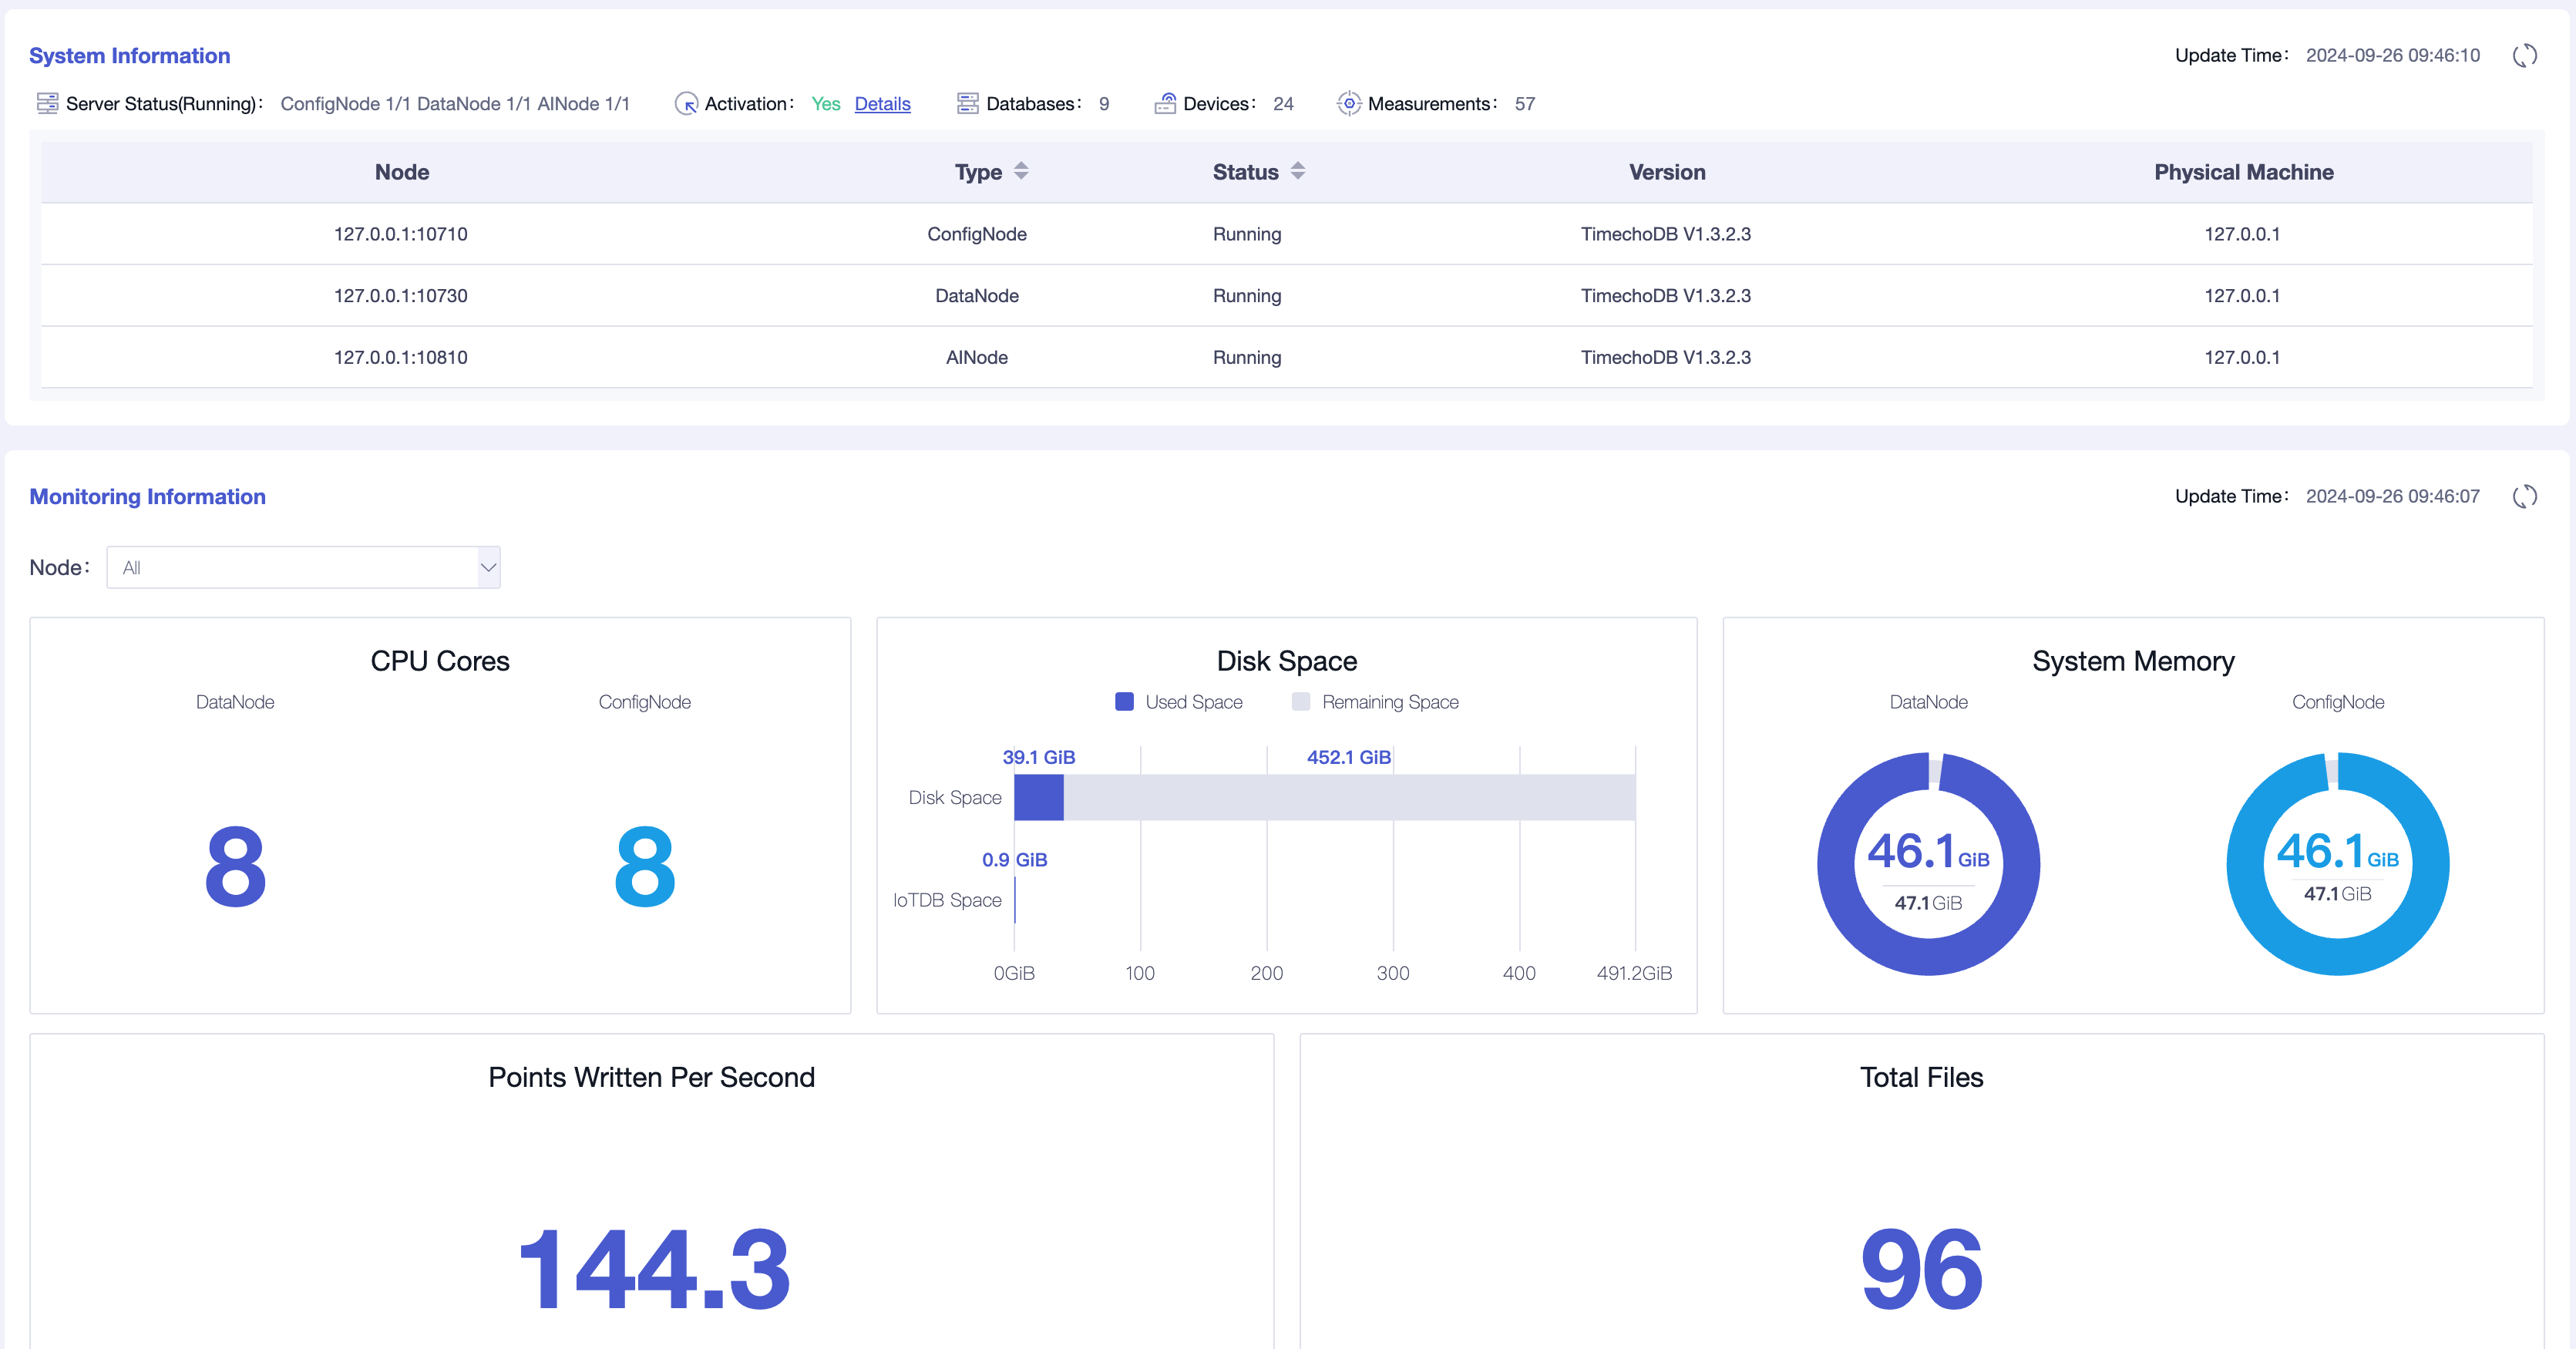
Verification successful: Open "
http://Server IP: Port in configuration file" in the browser to access, for example:"http://127.0.0.1:9190" When the login interface appears, it is considered successful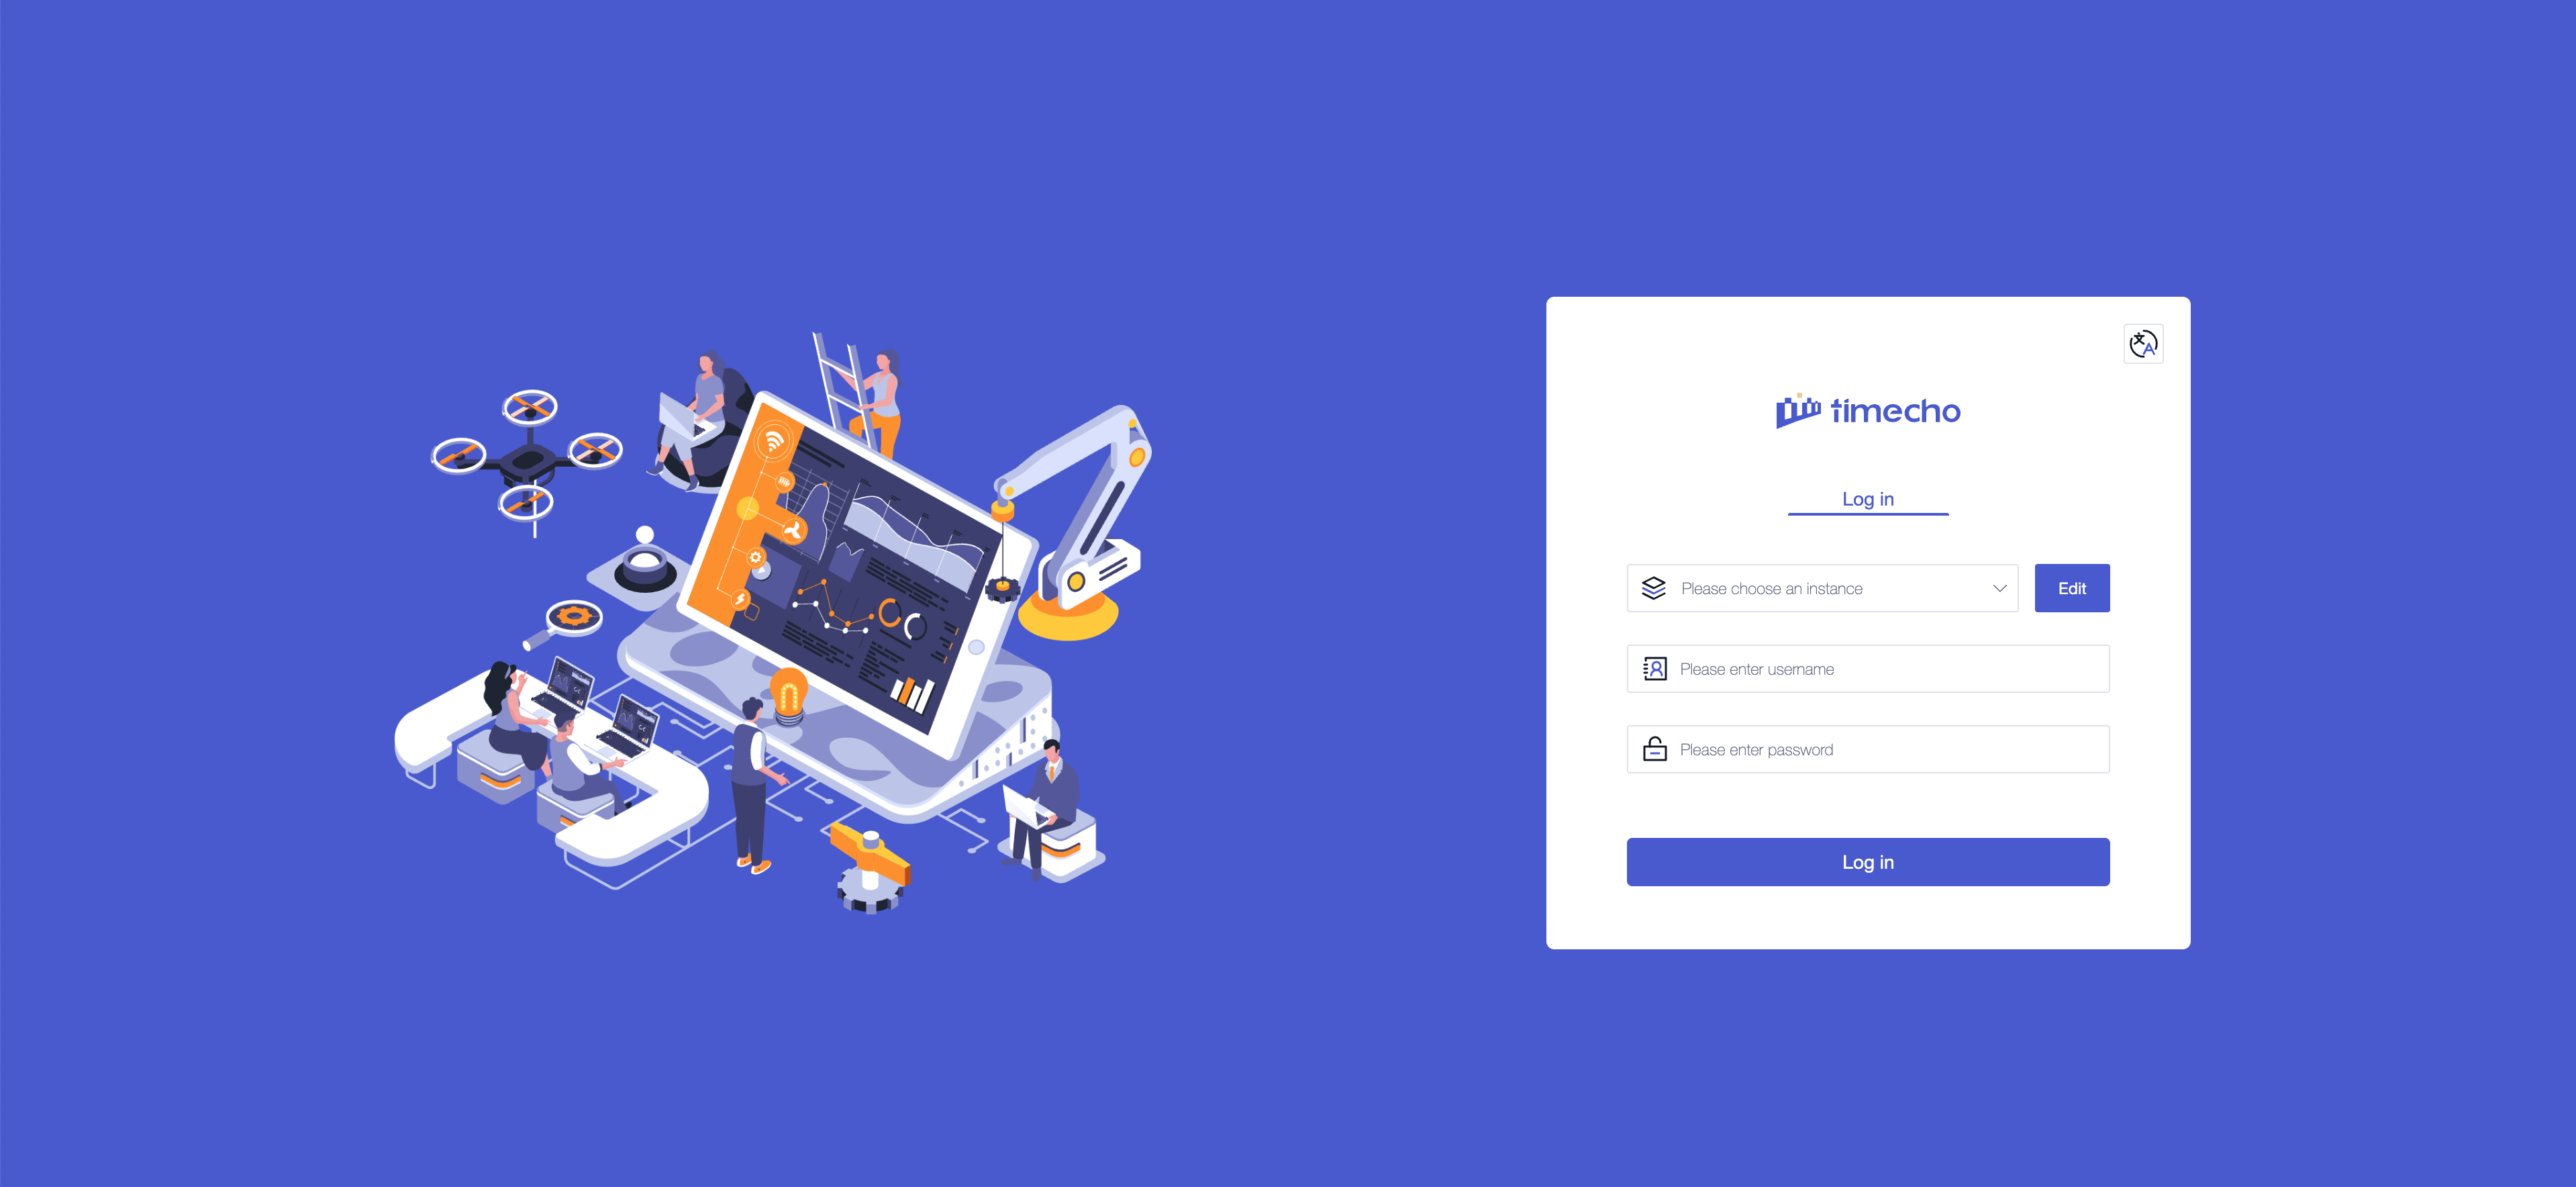
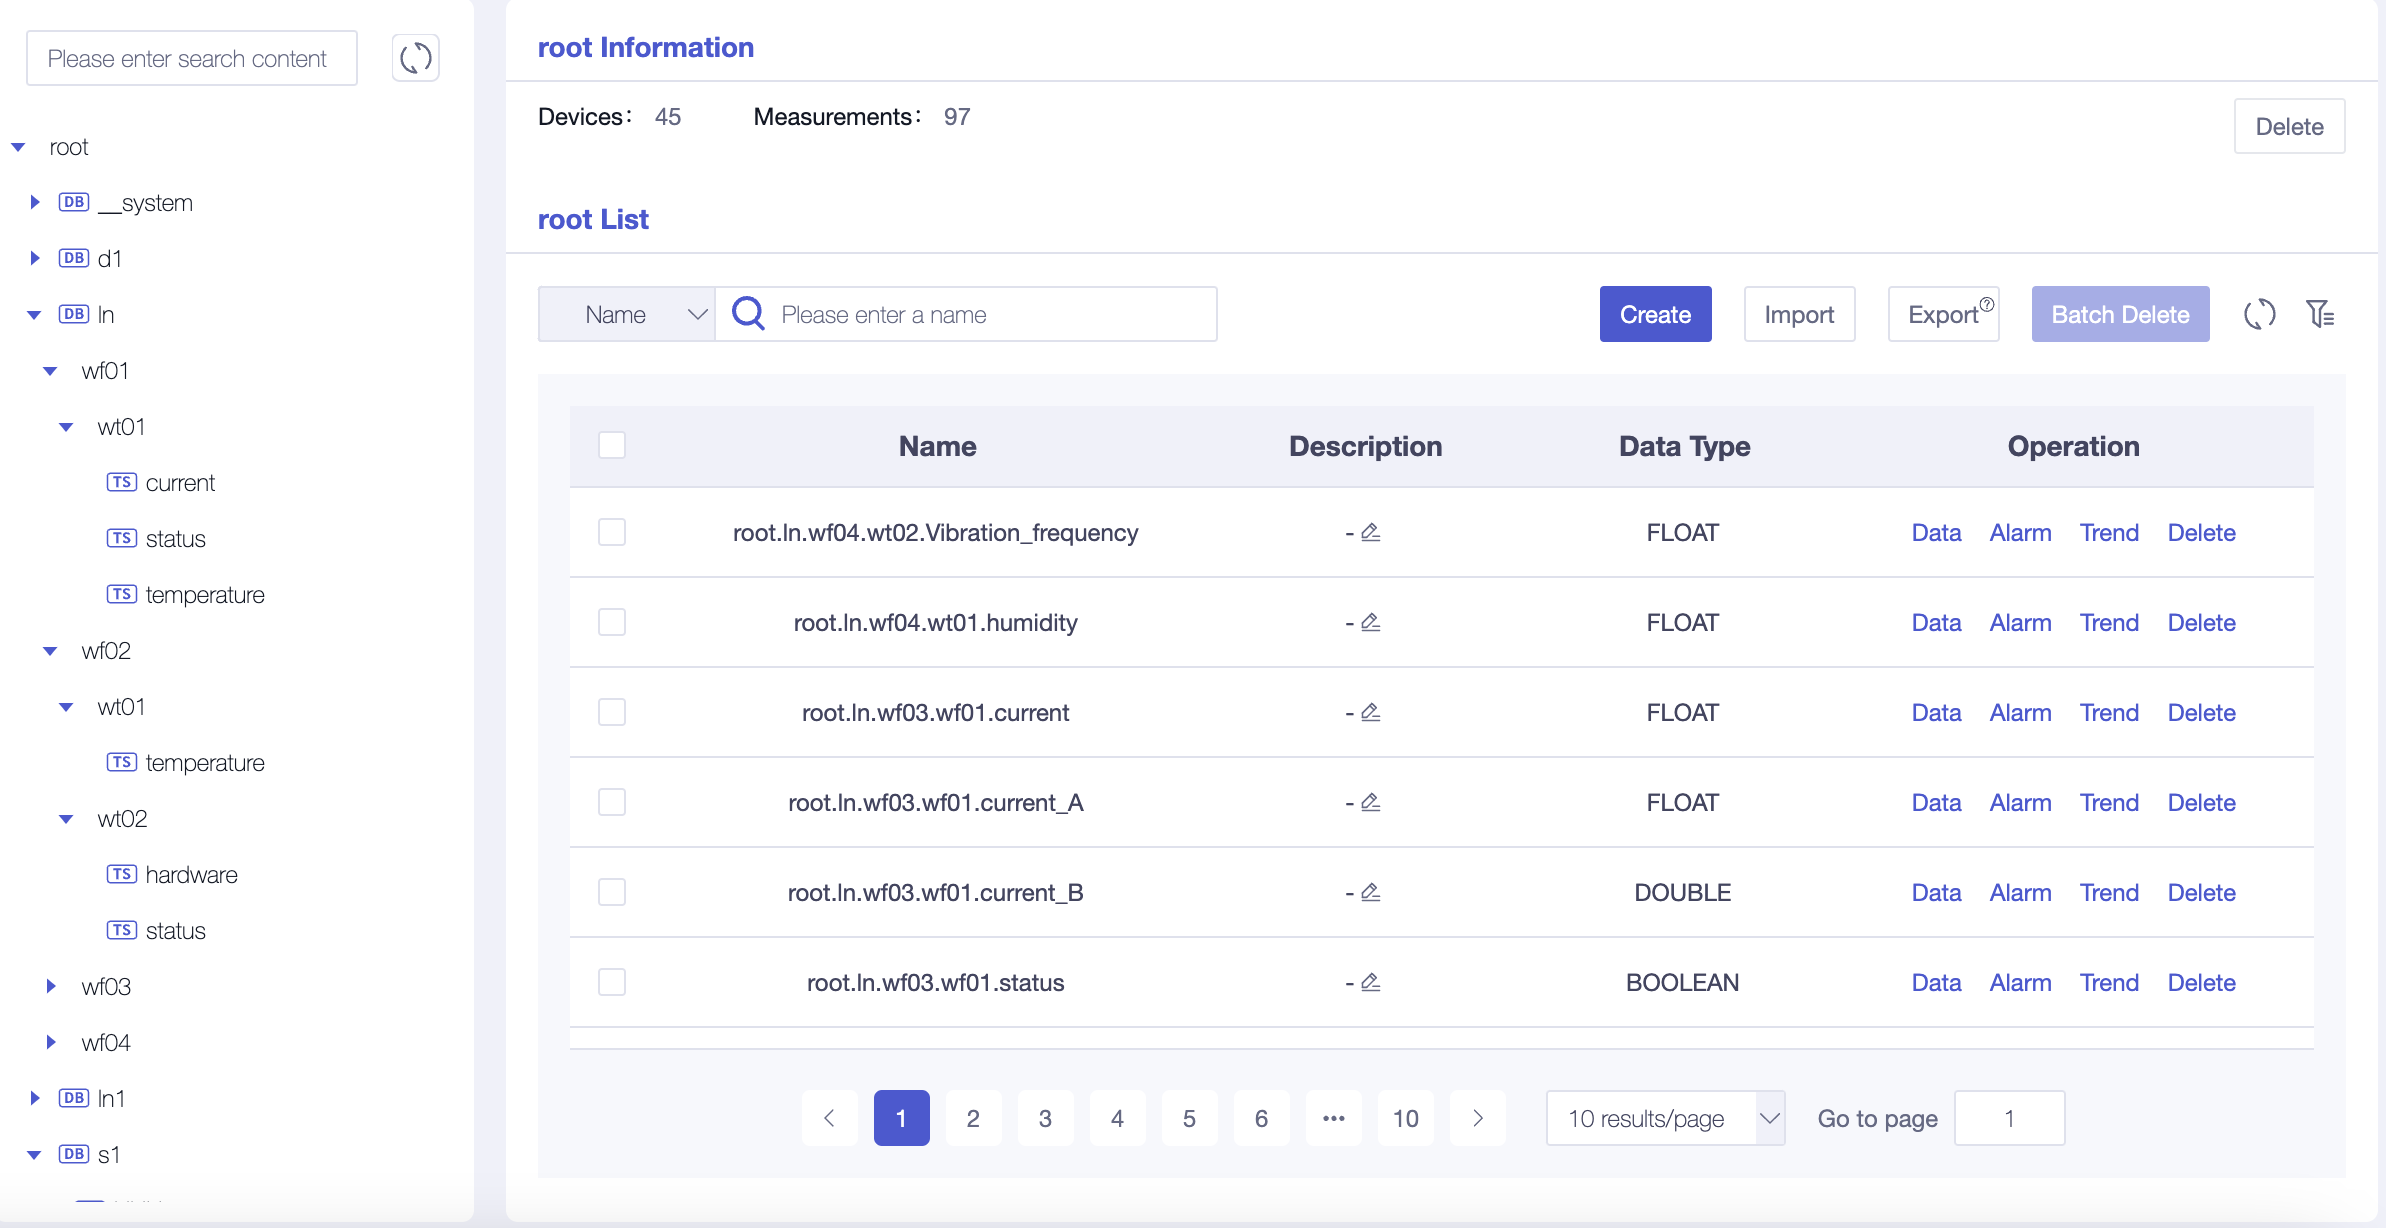
2.4 Configure Instance Information
Configure instance information: You only need to fill in the following information to connect to the instance
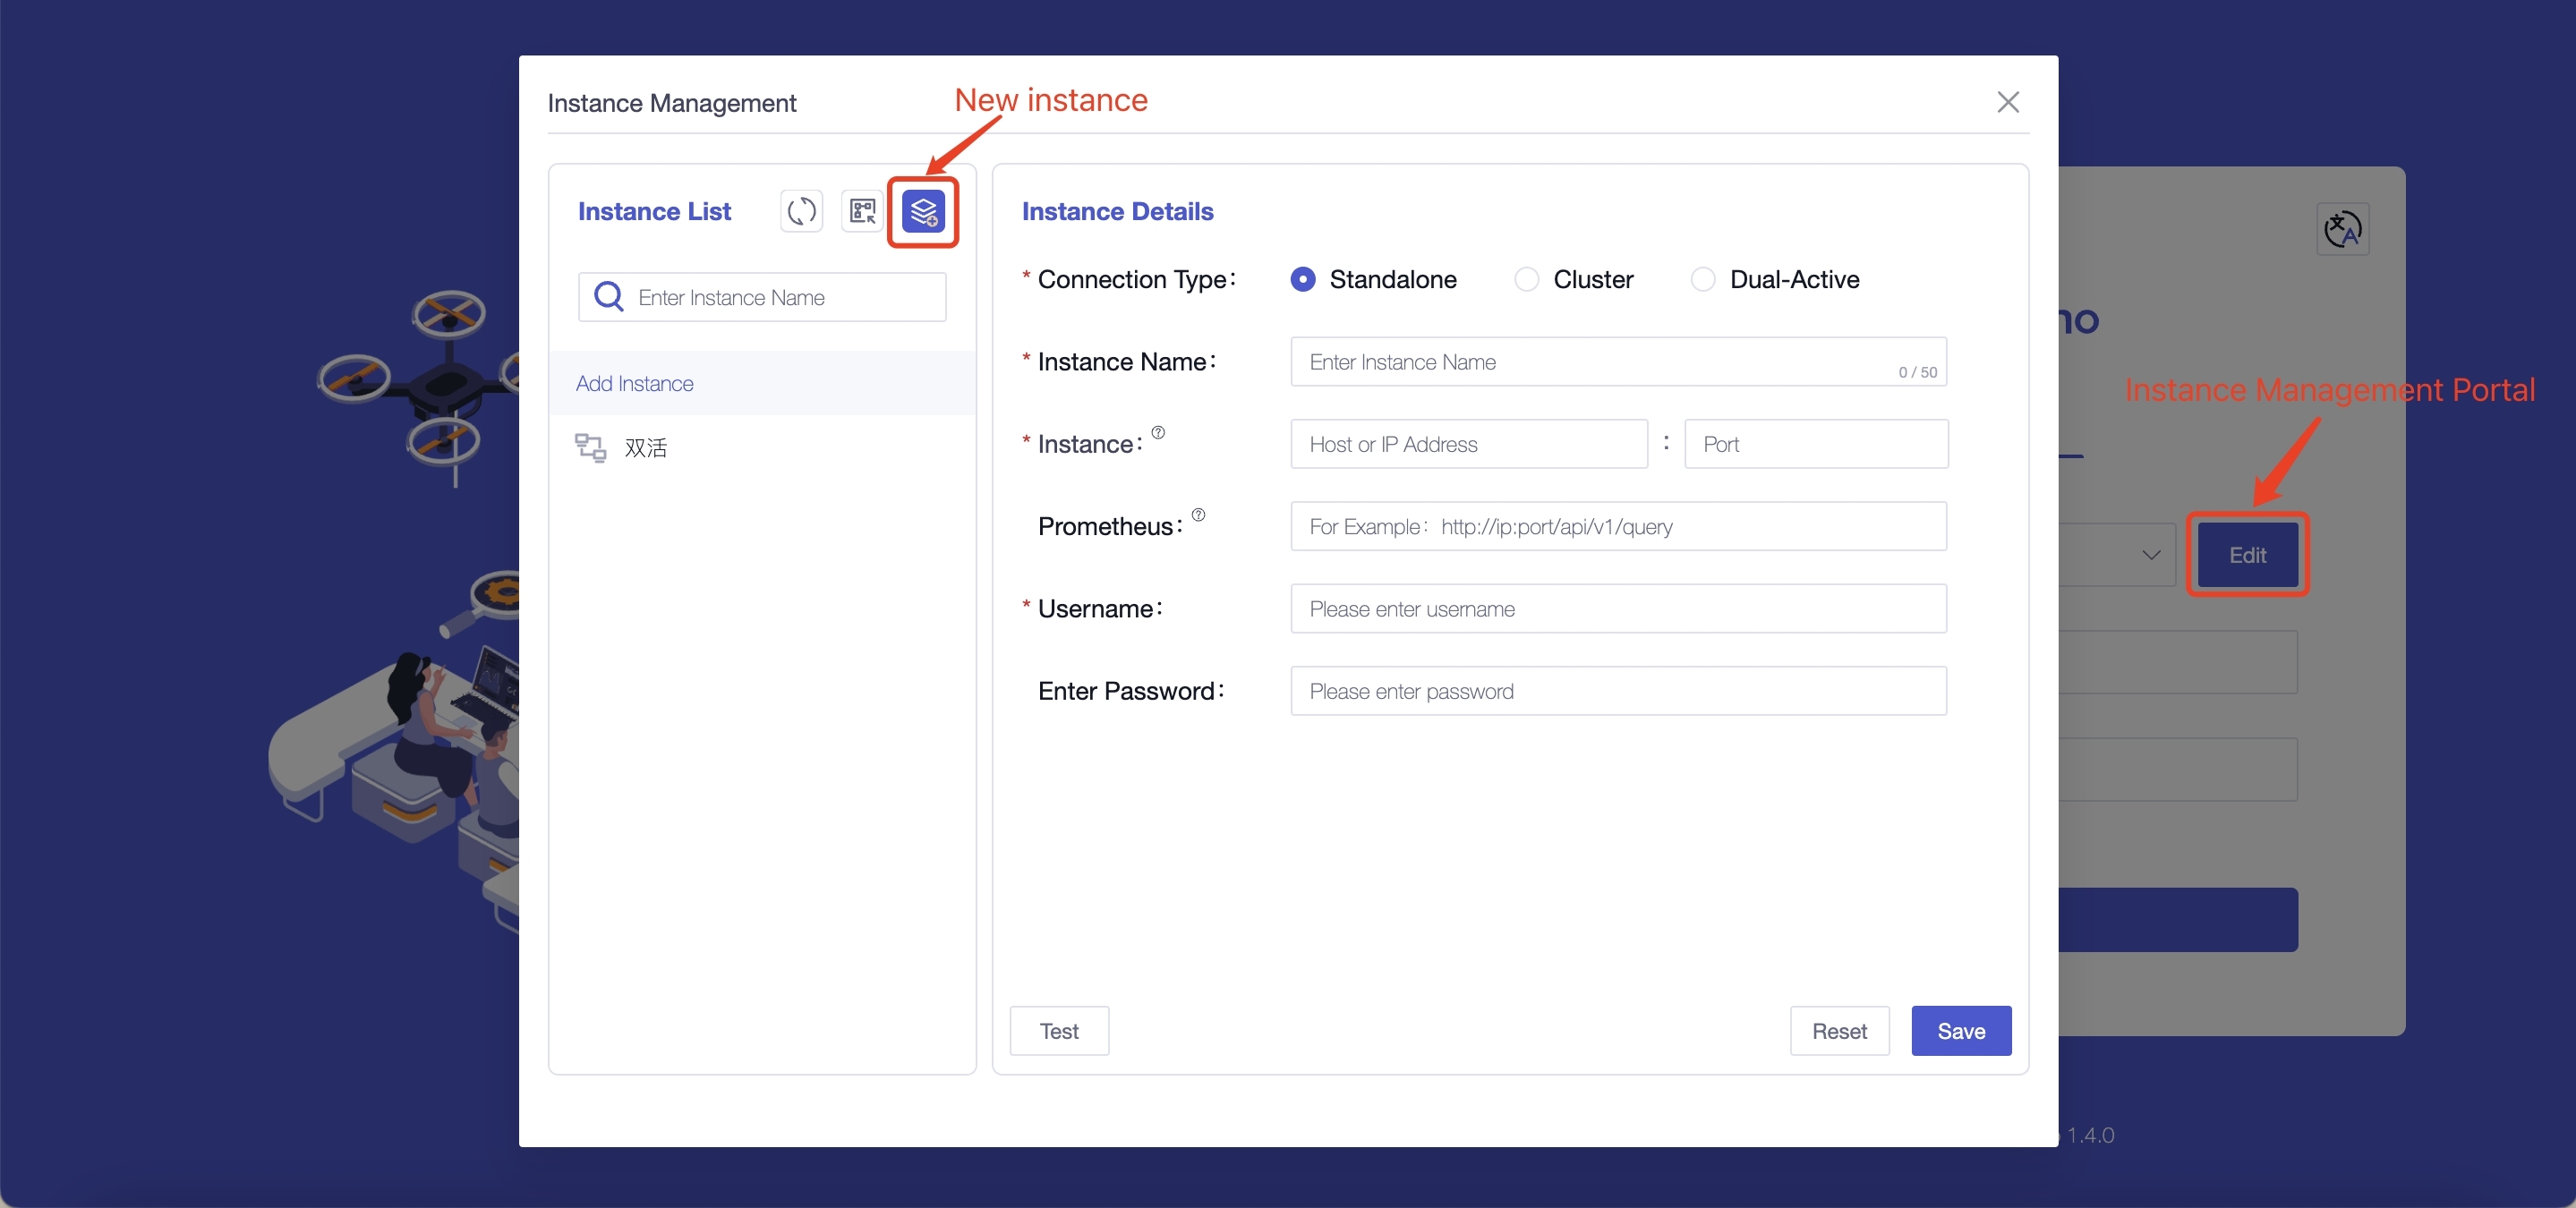
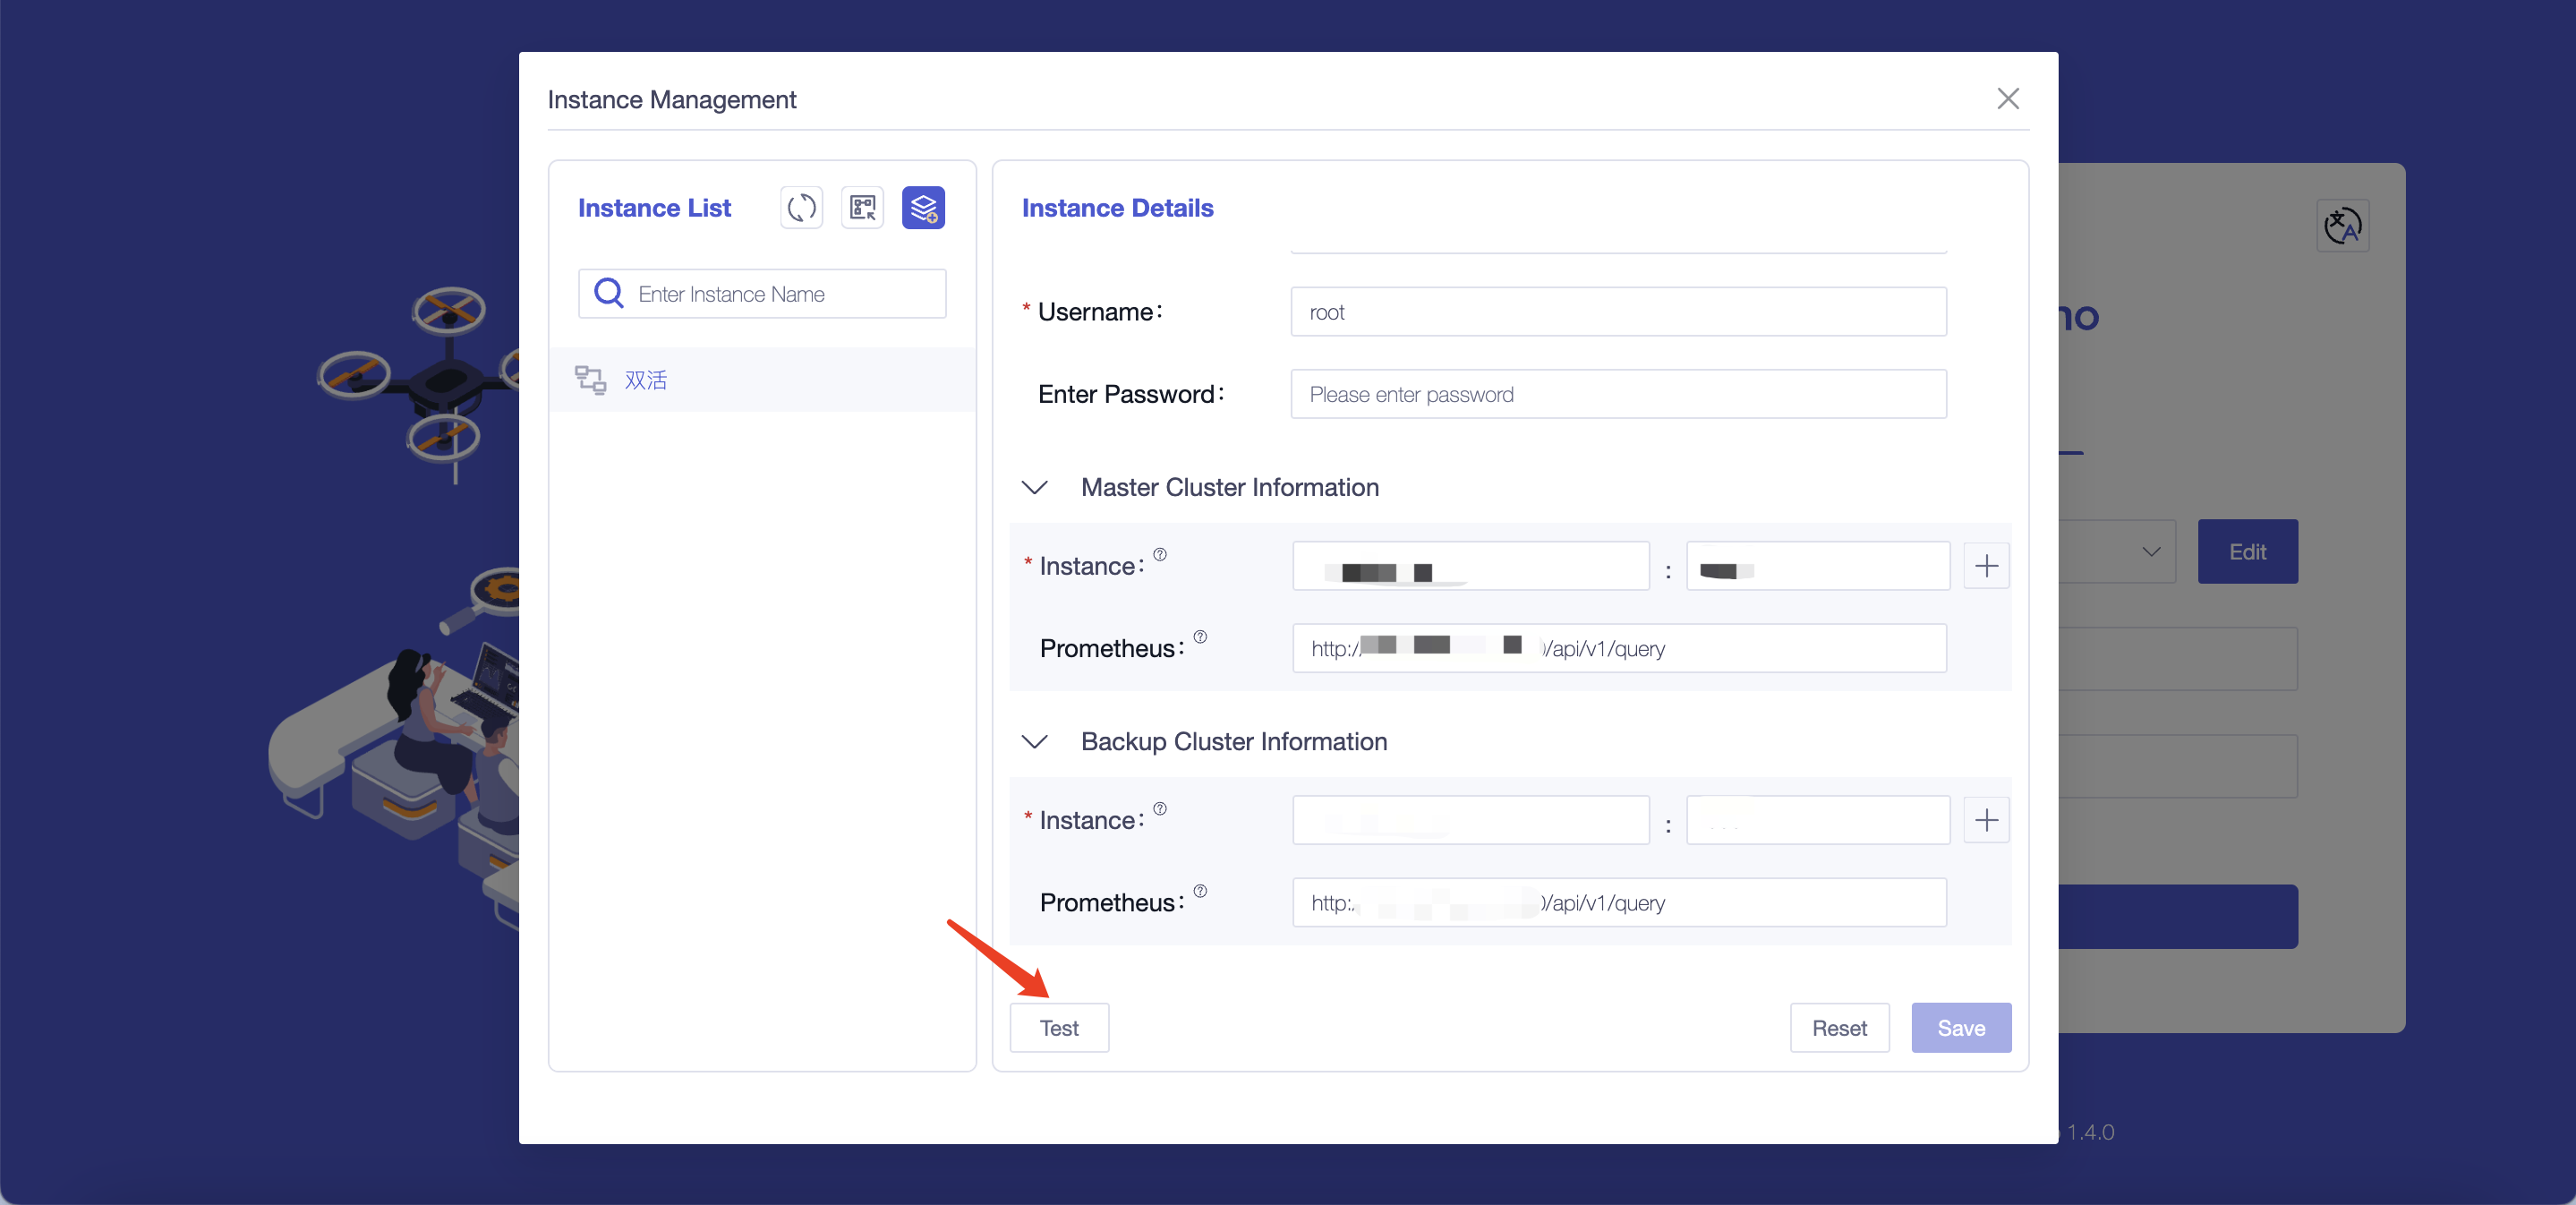
Field Name Is It A Required Field Field Meaning Default Value Connection Type Yes The content filled in for different connection types varies, and supports selecting "single machine, cluster, dual active" - Instance Name Yes You can distinguish different instances based on their names, with a maximum input of 50 characters - Instance Yes Fill in the database address ( dn_rpc_addressfield in theiotdb/conf/iotdb-system.propertiesfile) and port number (dn_rpc_portfield). Note: For clusters and dual active devices, clicking the "+" button supports entering multiple instance information- Prometheus No Fill in http://<Prometheus IP address>:<Prometheus port number>/app/v1/queryto view some monitoring information on the homepage. We recommend that you configure and use it- Username Yes Fill in the username for IoTDB, supporting input of 4 to 32 characters, including uppercase and lowercase letters, numbers, and special characters (! @ # $% ^&* () _+-=) root Enter Password No Fill in the password for IoTDB. To ensure the security of the database, we will not save the password. Please fill in the password yourself every time you connect to the instance or test root Test the accuracy of the information filled in: You can perform a connection test on the instance information by clicking the "Test" button
3. Appendix: IoTDB and Workbench Version Comparison Table
| Version | Description | Supported IoTDB Versions |
|---|---|---|
| V2.0.1-beta | The first version of the V2.x series, supporting dual models of tree and table | V2.0 and above, The AI analysis module only supports versions above 2.0.5. |
| V1.5.7 | Optimize the point list by splitting point names into device names and points, ensure the point selection area supports horizontal scrolling, and align the export file column order with the page display. | All 1.x versions from V1.3.4 onward |
| V1.5.6 | Enhanced CSV import/export: optional tags/aliases on import; support for measurement descriptions with backtick-quoted quotes on export. | All 1.x versions from V1.3.4 onward |
| V1.5.5 | Added server clock functionality and support for activating Enterprise Edition license databases | All 1.x versions from V1.3.4 onward |
| V1.5.4 | Added authentication for Prometheus settings in Instance Management | All 1.x versions from V1.3.4 onward |
| V1.5.1 | Added AI analysis and pattern matching | All 1.x versions from V1.3.2 onward |
| V1.4.0 | Added tree model display and English UI | All 1.x versions from V1.3.2 onward |
| V1.3.1 | Enhanced analysis methods and import templates | All 1.x versions from V1.3.2 onward |
| V1.3.0 | Added DB configuration and UI refinements | All 1.x versions from V1.3.2 onward |
| V1.2.6 | Optimized permission controls | All 1.x versions from V1.3.1 onward |
| V1.2.5 | Added "Common Templates" and caching | All 1.x versions from V1.3.0 onward |
| V1.2.4 | Added import/export for calculations, time alignment field | All 1.x versions from V1.2.2 onward |
| V1.2.3 | Added activation details and analysis features | All 1.x versions from V1.2.2 onward |
| V1.2.2 | Optimized point description display | All 1.x versions from V1.2.2 onward |
| V1.2.1 | Added sync monitoring panel, Prometheus hints | All 1.x versions from V1.2.2 onward |
| V1.2.0 | Major Workbench upgrade | All 1.x versions from V1.2.0 onward |